My First Data Engineering Project: Job Data Gathering & Visualization
This was one of my first large-scale projects before I built a live data pipeline for a local government intranet using PowerShell. The goal was to collect job listings from CVKeskus, store them in a MySQL database, and visualize locations on an interactive map.
Project Overview
- Python Web Scraper: Extracted job postings from CVKeskus across multiple pages (over 1,100 jobs).
- Responsible Crawling: Implemented delays to avoid overloading the website.
- Structured Storage: Saved all fields into a MySQL database for analysis.
List of Jobs.
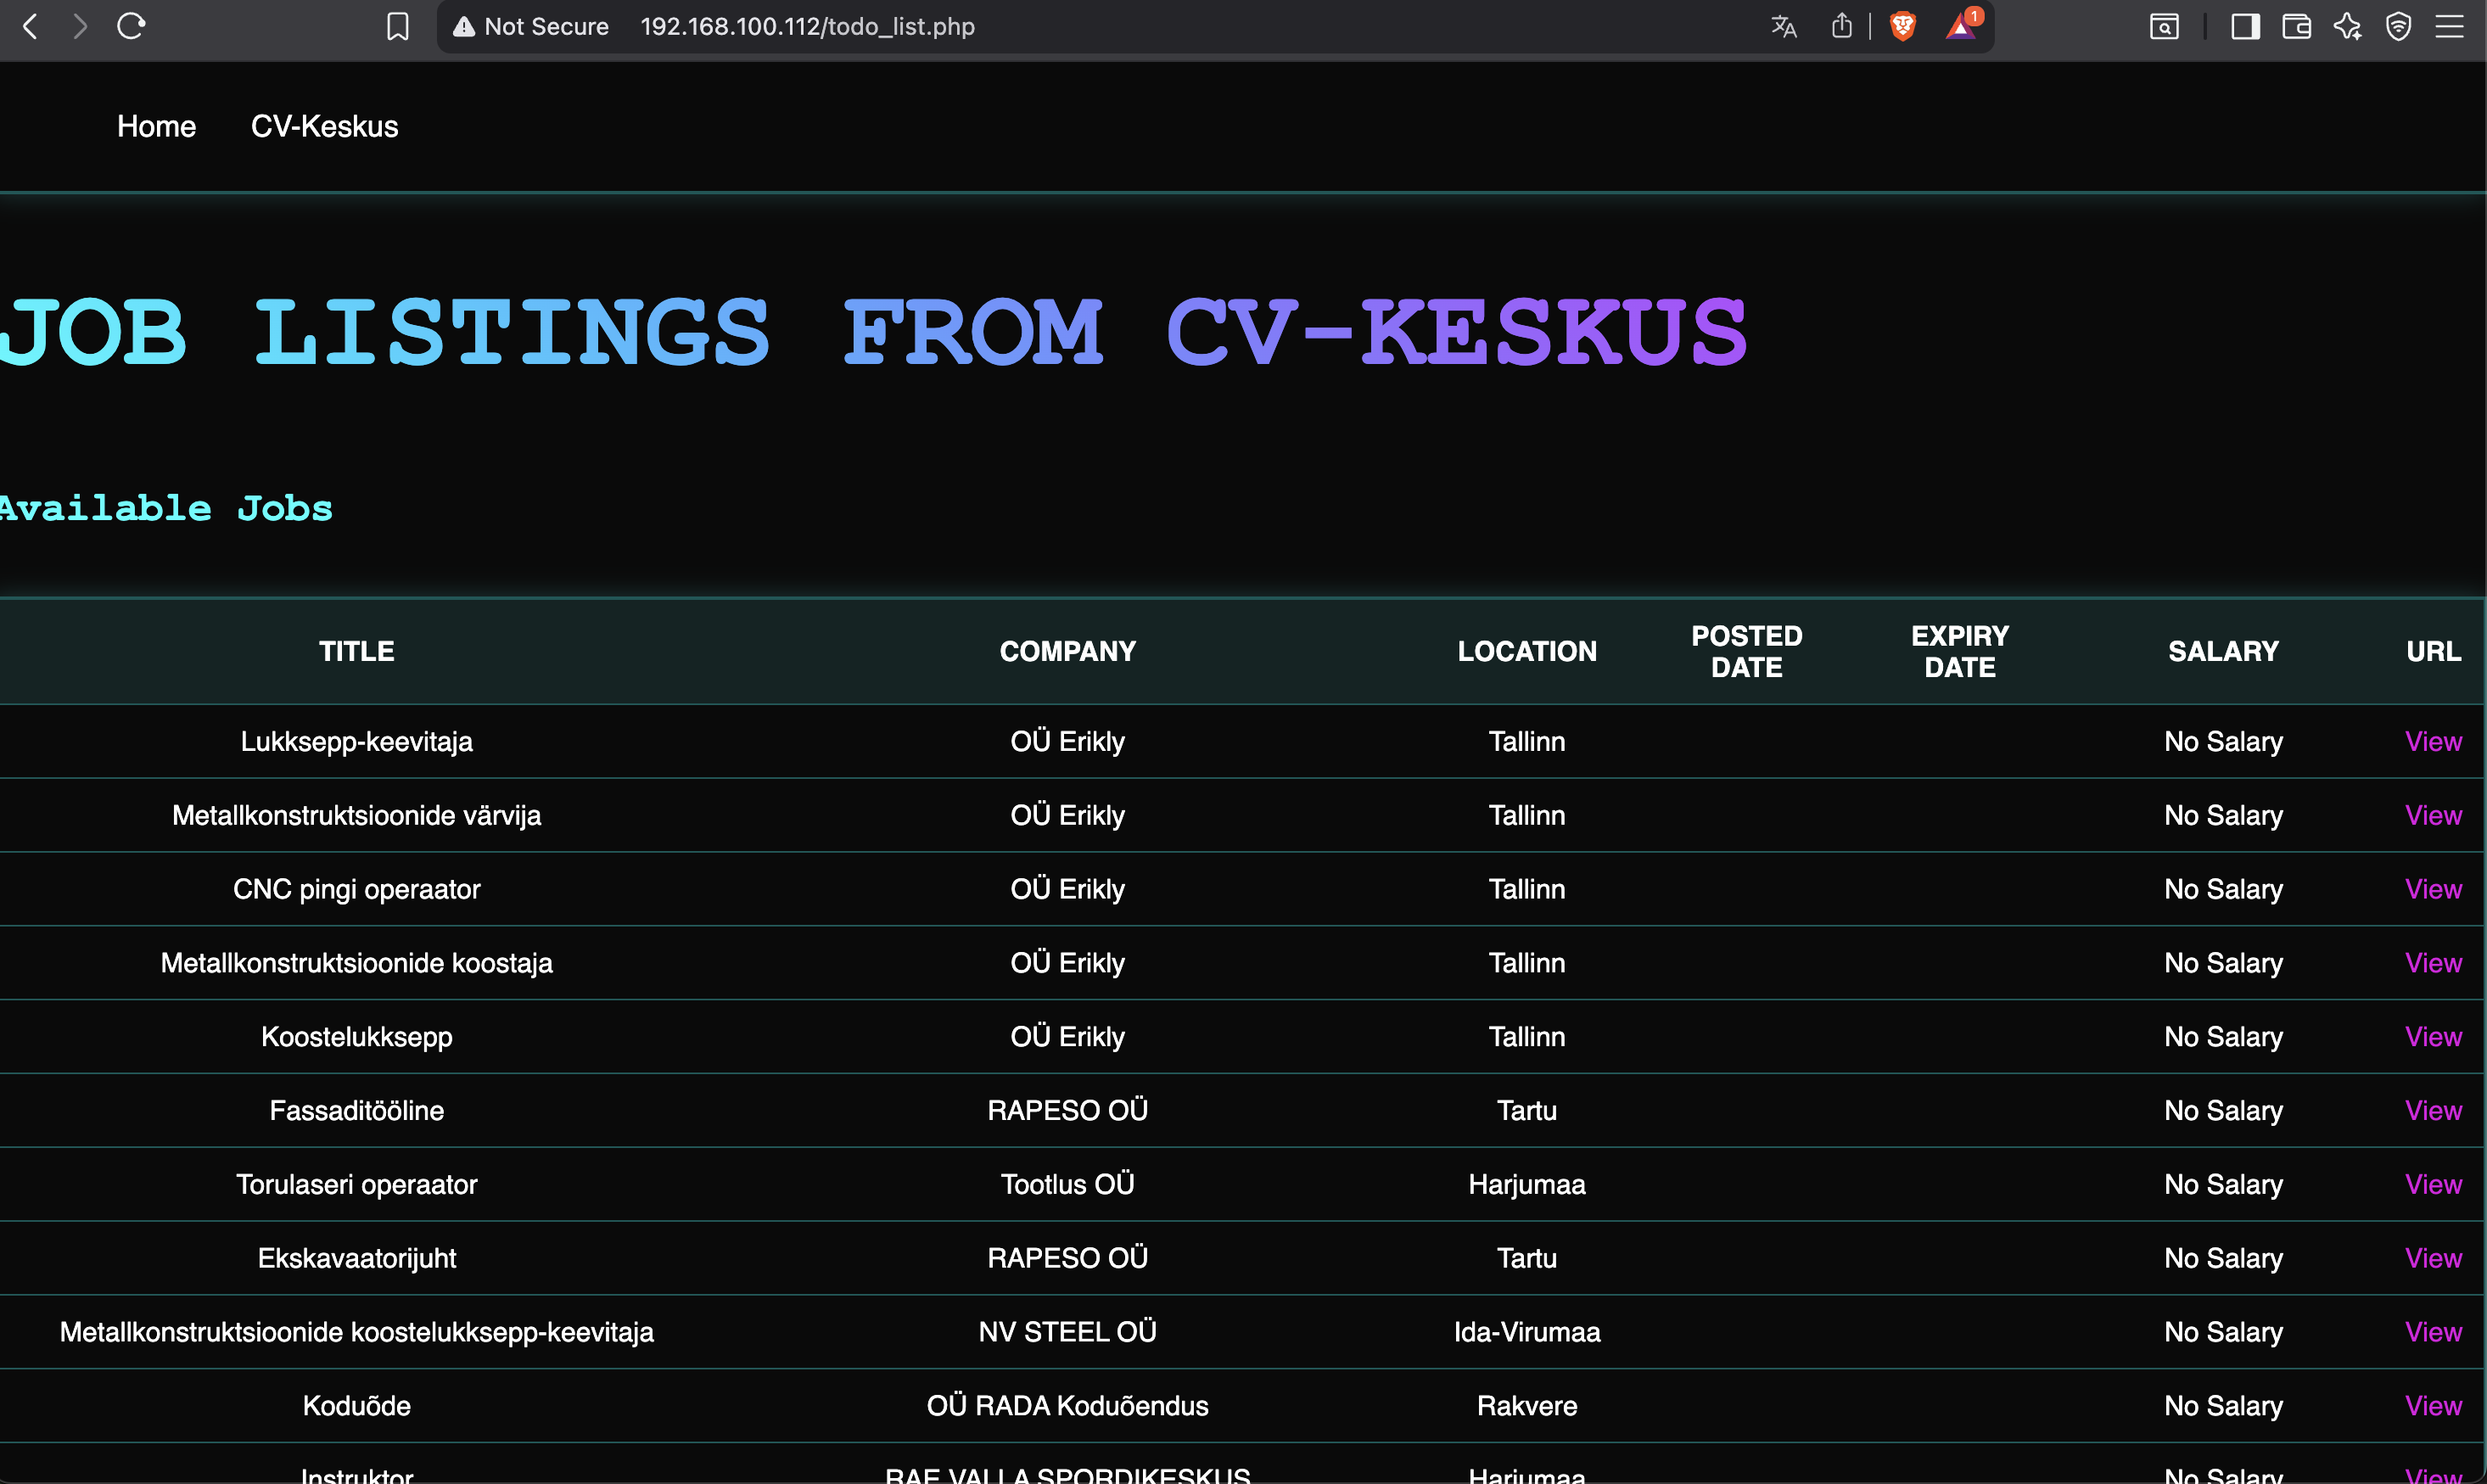
On the webpage, it's possible to check what jobs are available with salary. I had some problems with date and time though.
Interactive Map with Mouse-Over Details
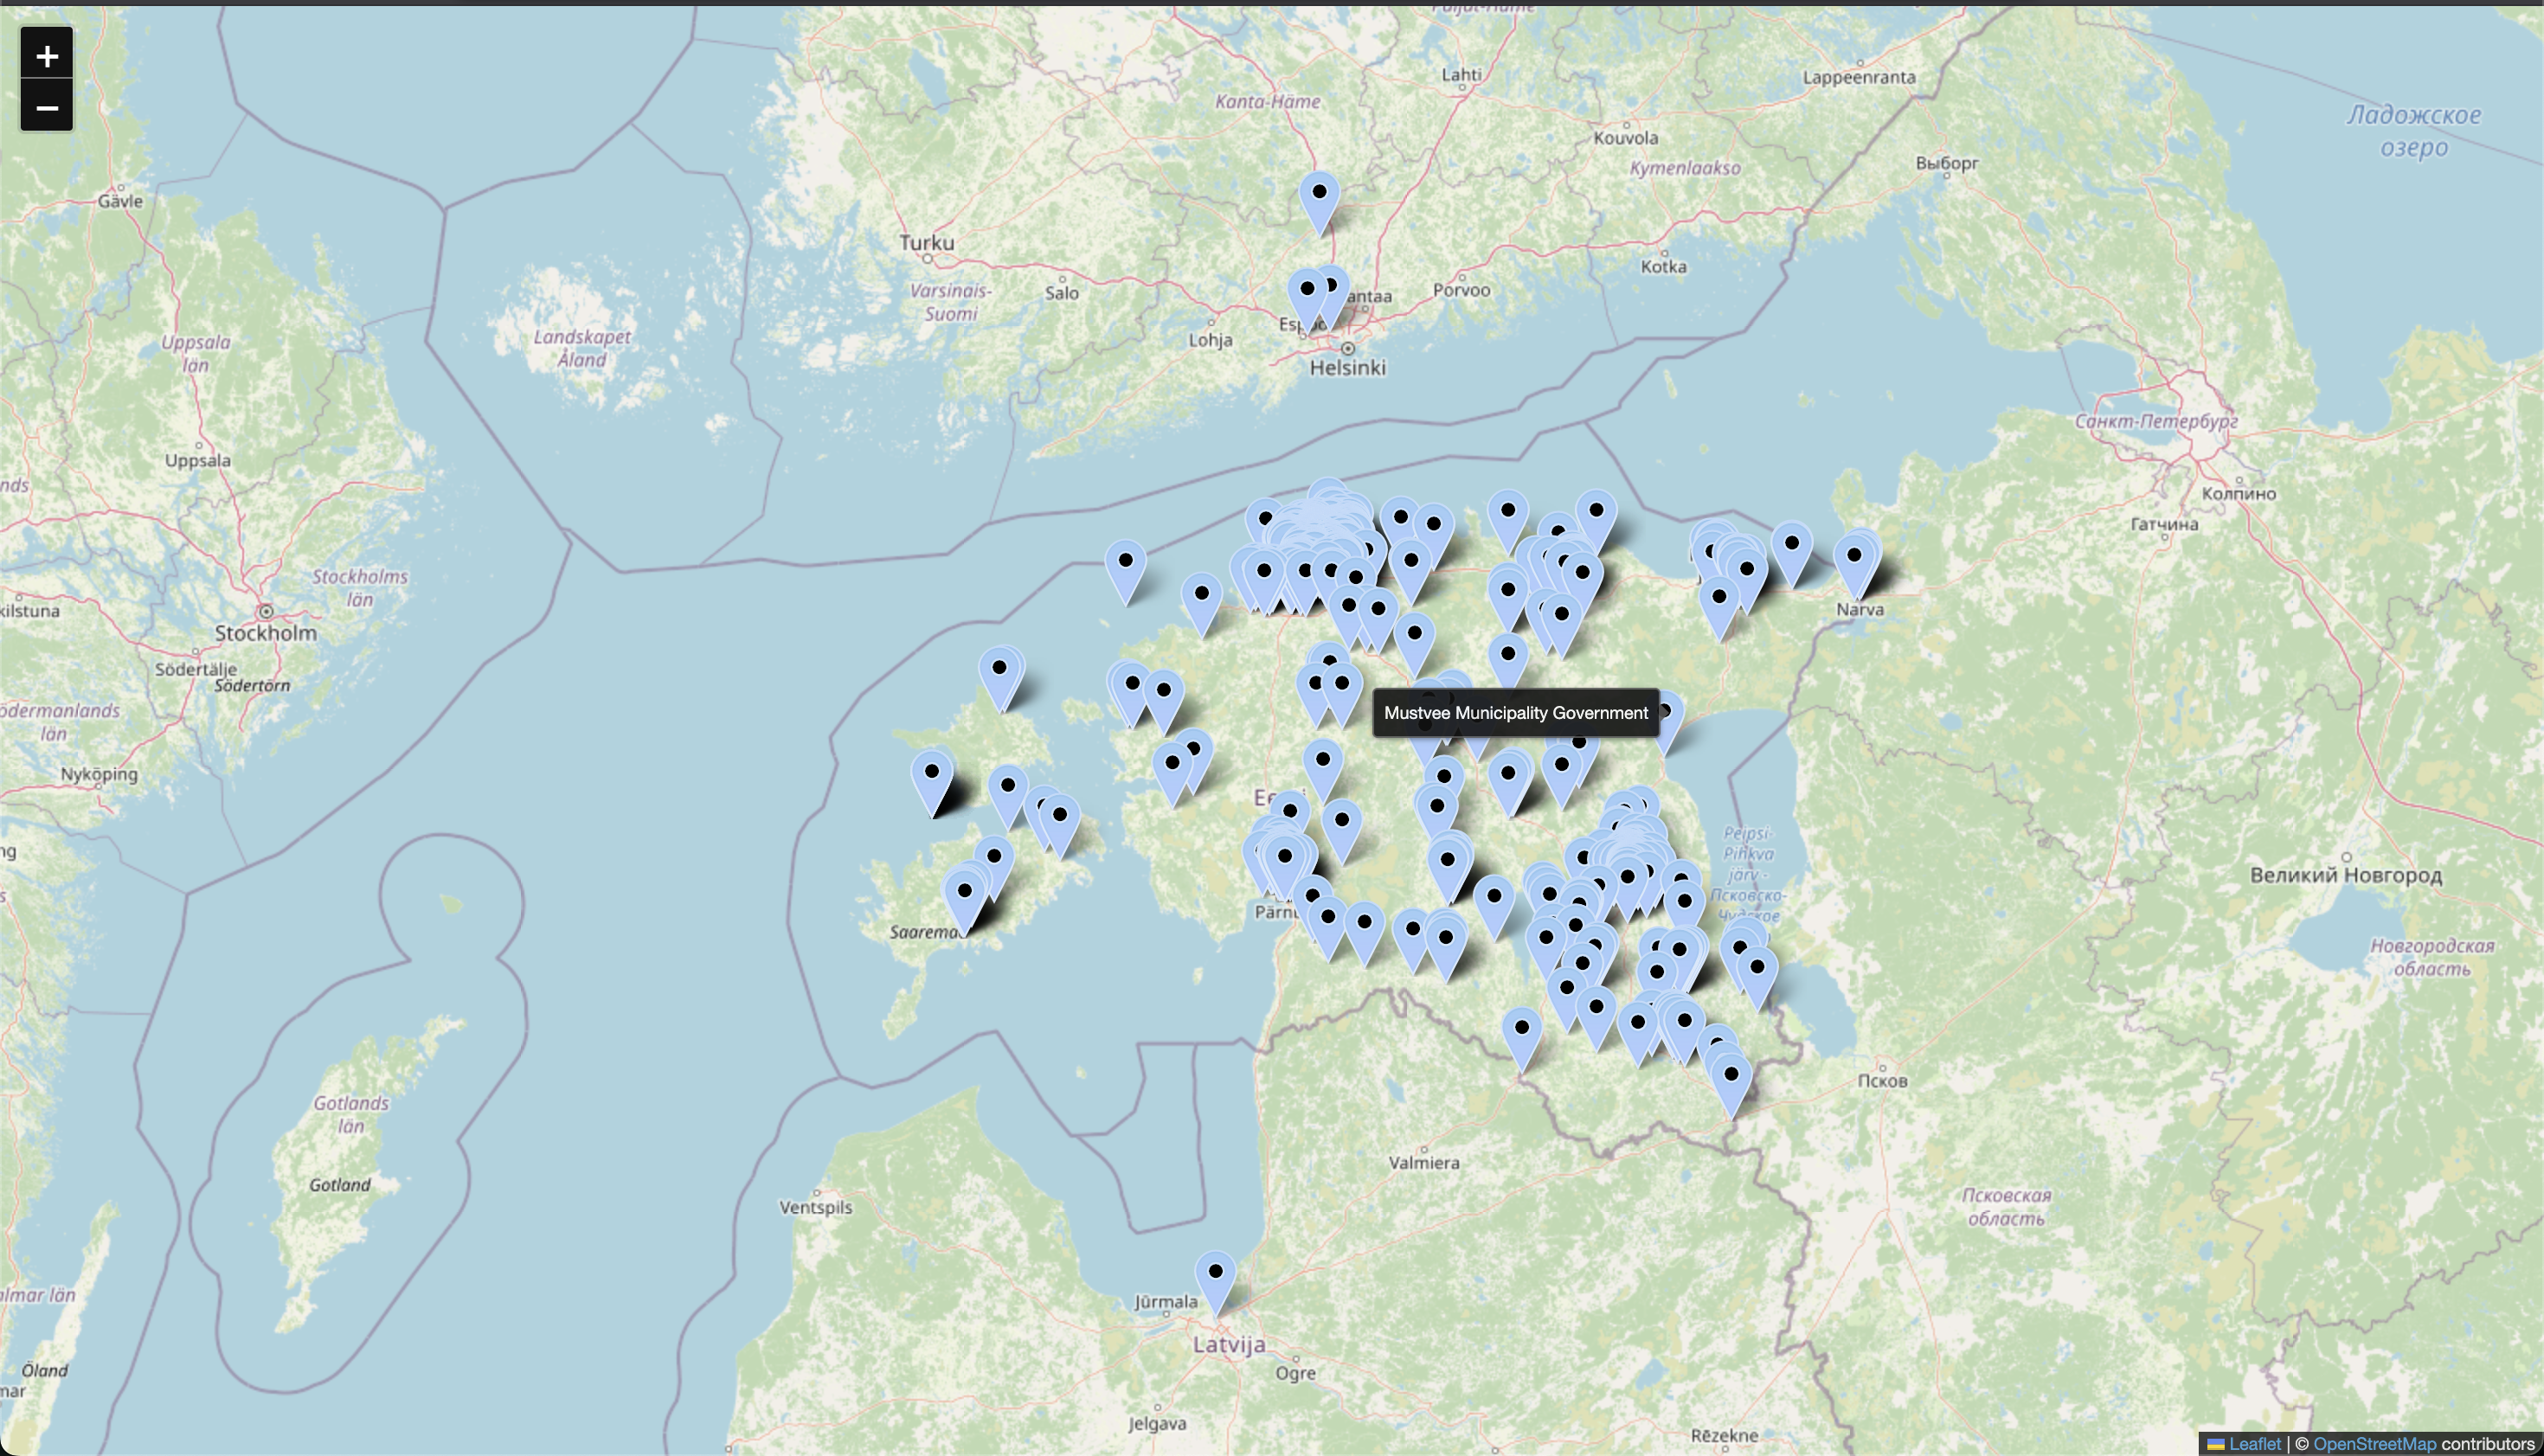
Mapped job locations and enabled mouse-over to show company details.
Adding Location Intelligence
- Geocoding: Converted company addresses into geographical coordinates.
- City-Level Views: Created zoomed maps for major cities to reveal local job clusters.
- Accuracy: Achieved ~75% successful coordinate matches; multi-office companies were harder to pinpoint.
Zoomed View: Tallinn
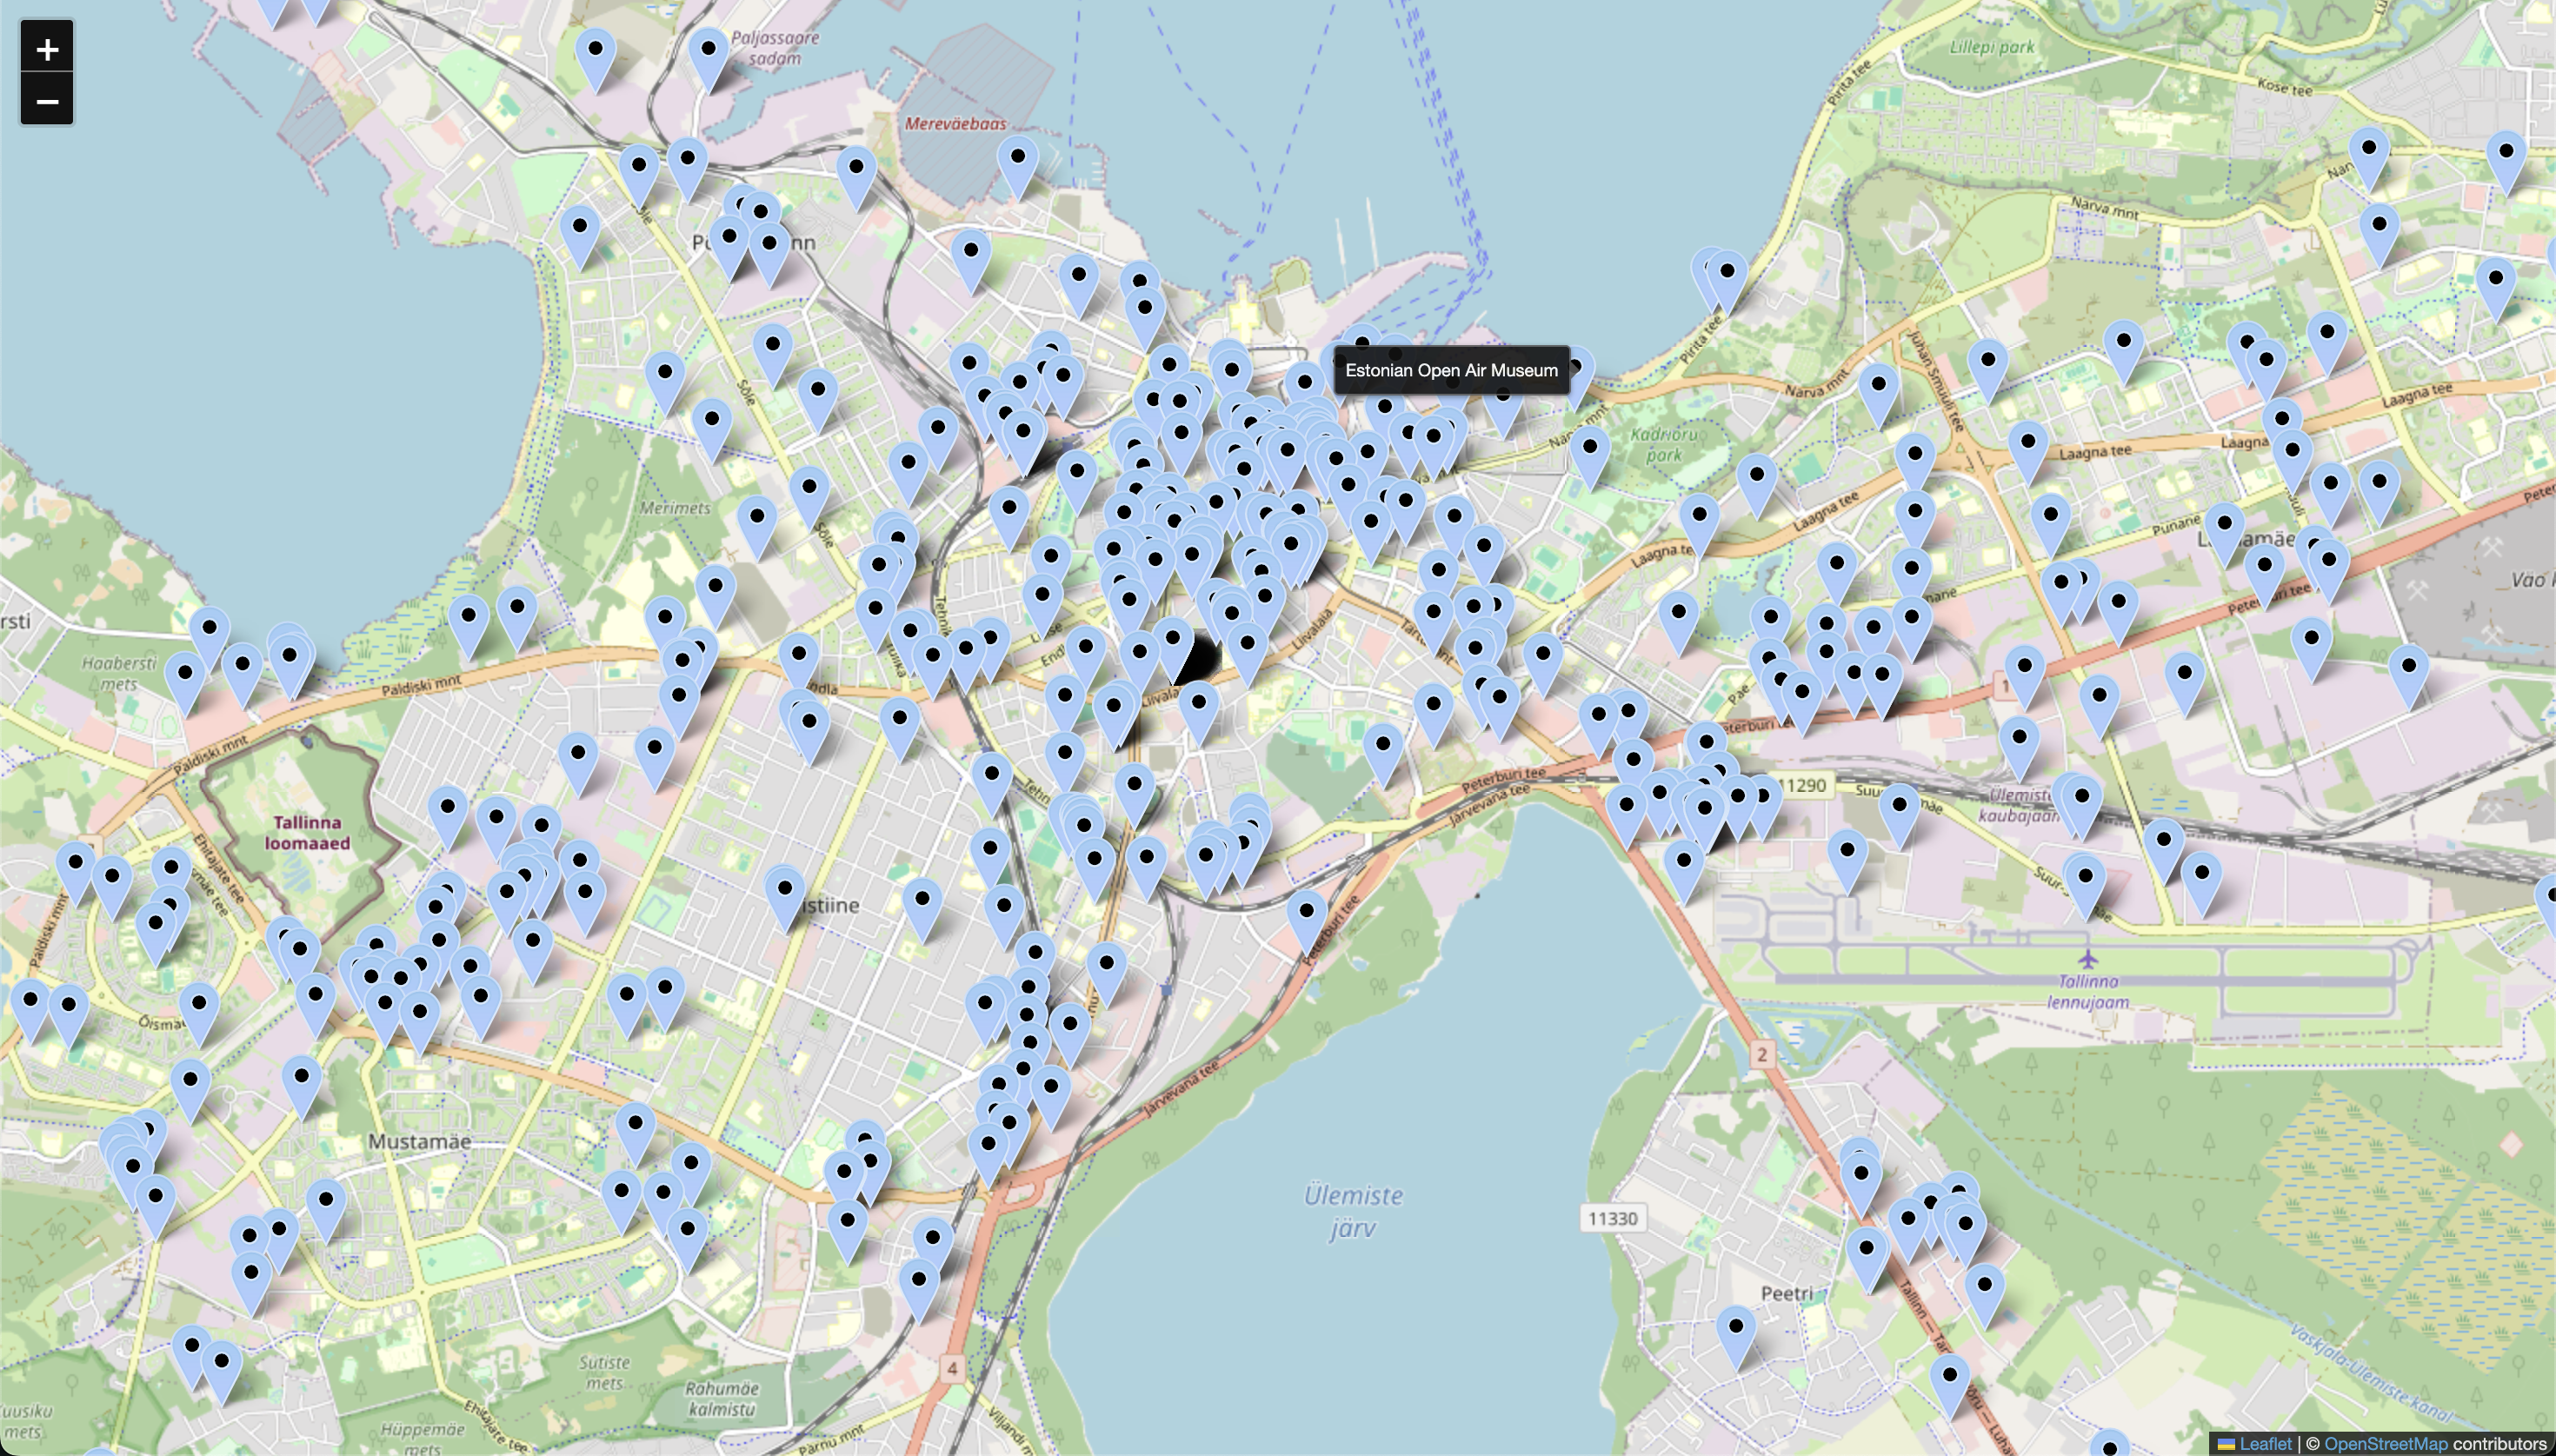
Each blue pin represents a company location in the capital.
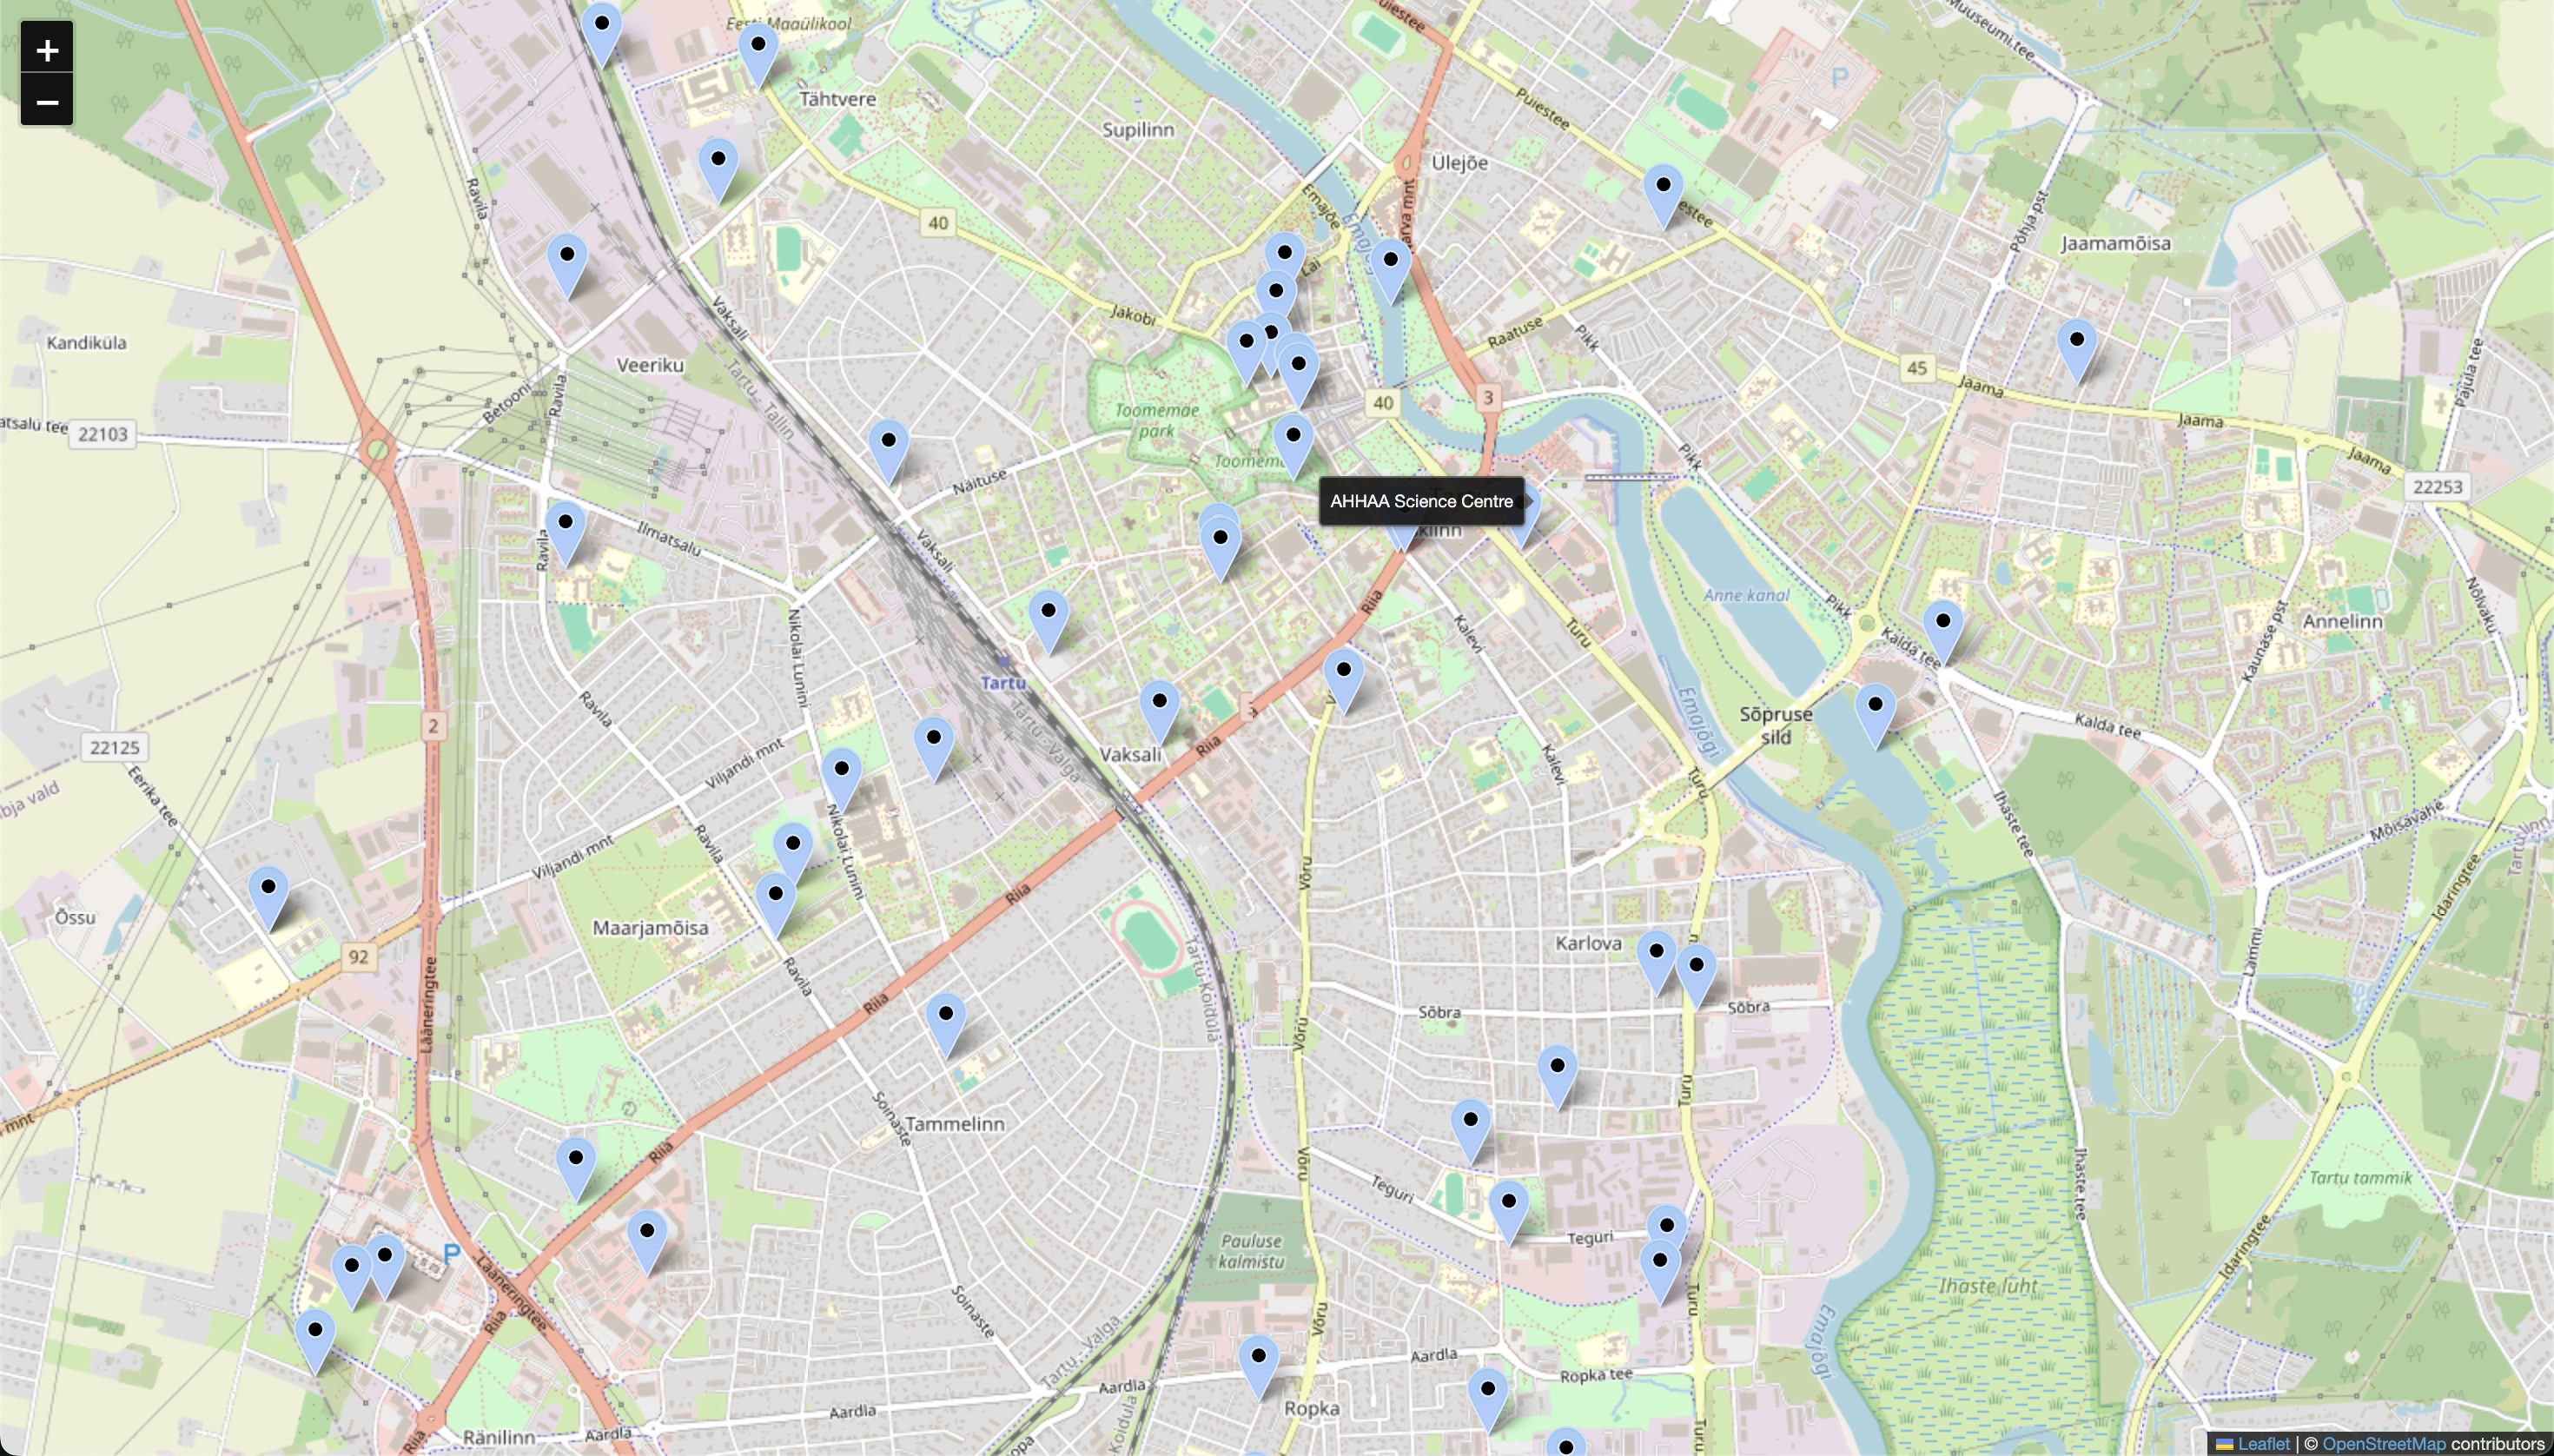
Zoomed View: Tartu
Company Coordinates Overview
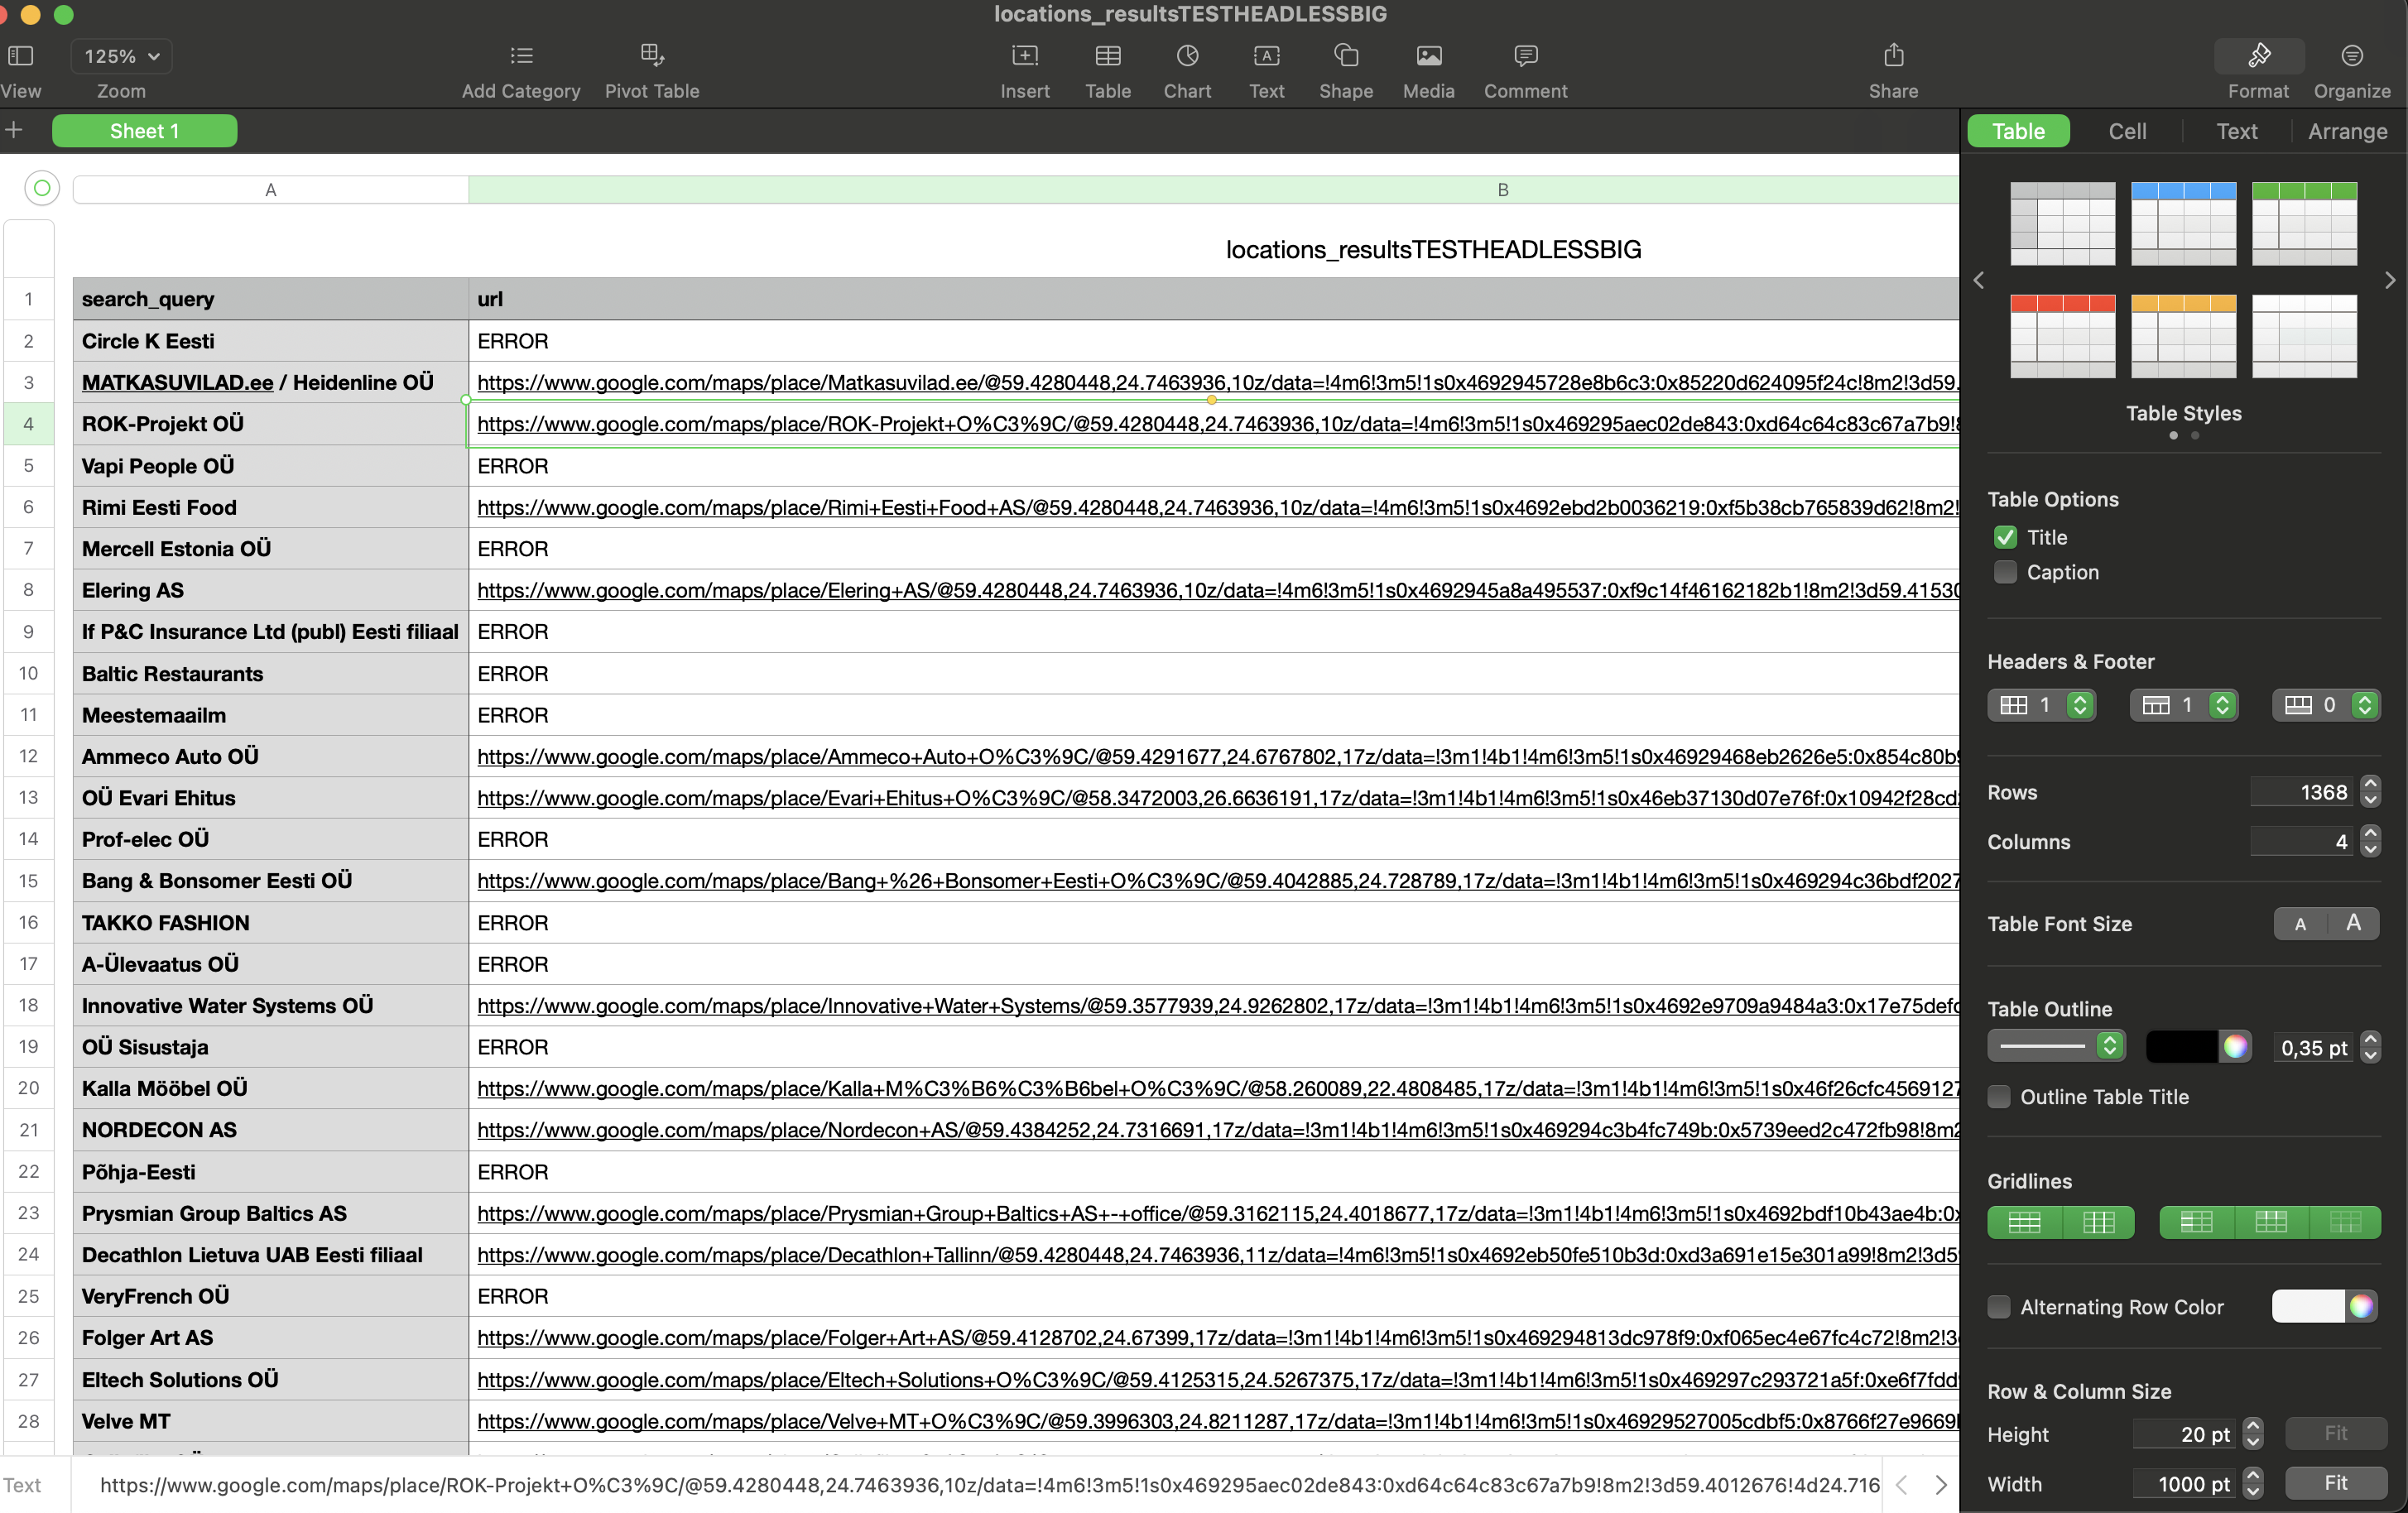
Success rate: Around 75% for coordinate detection. When companies had multiple buildings, automation couldn’t reliably choose the correct one and sometimes failed.
Salary Data Availability
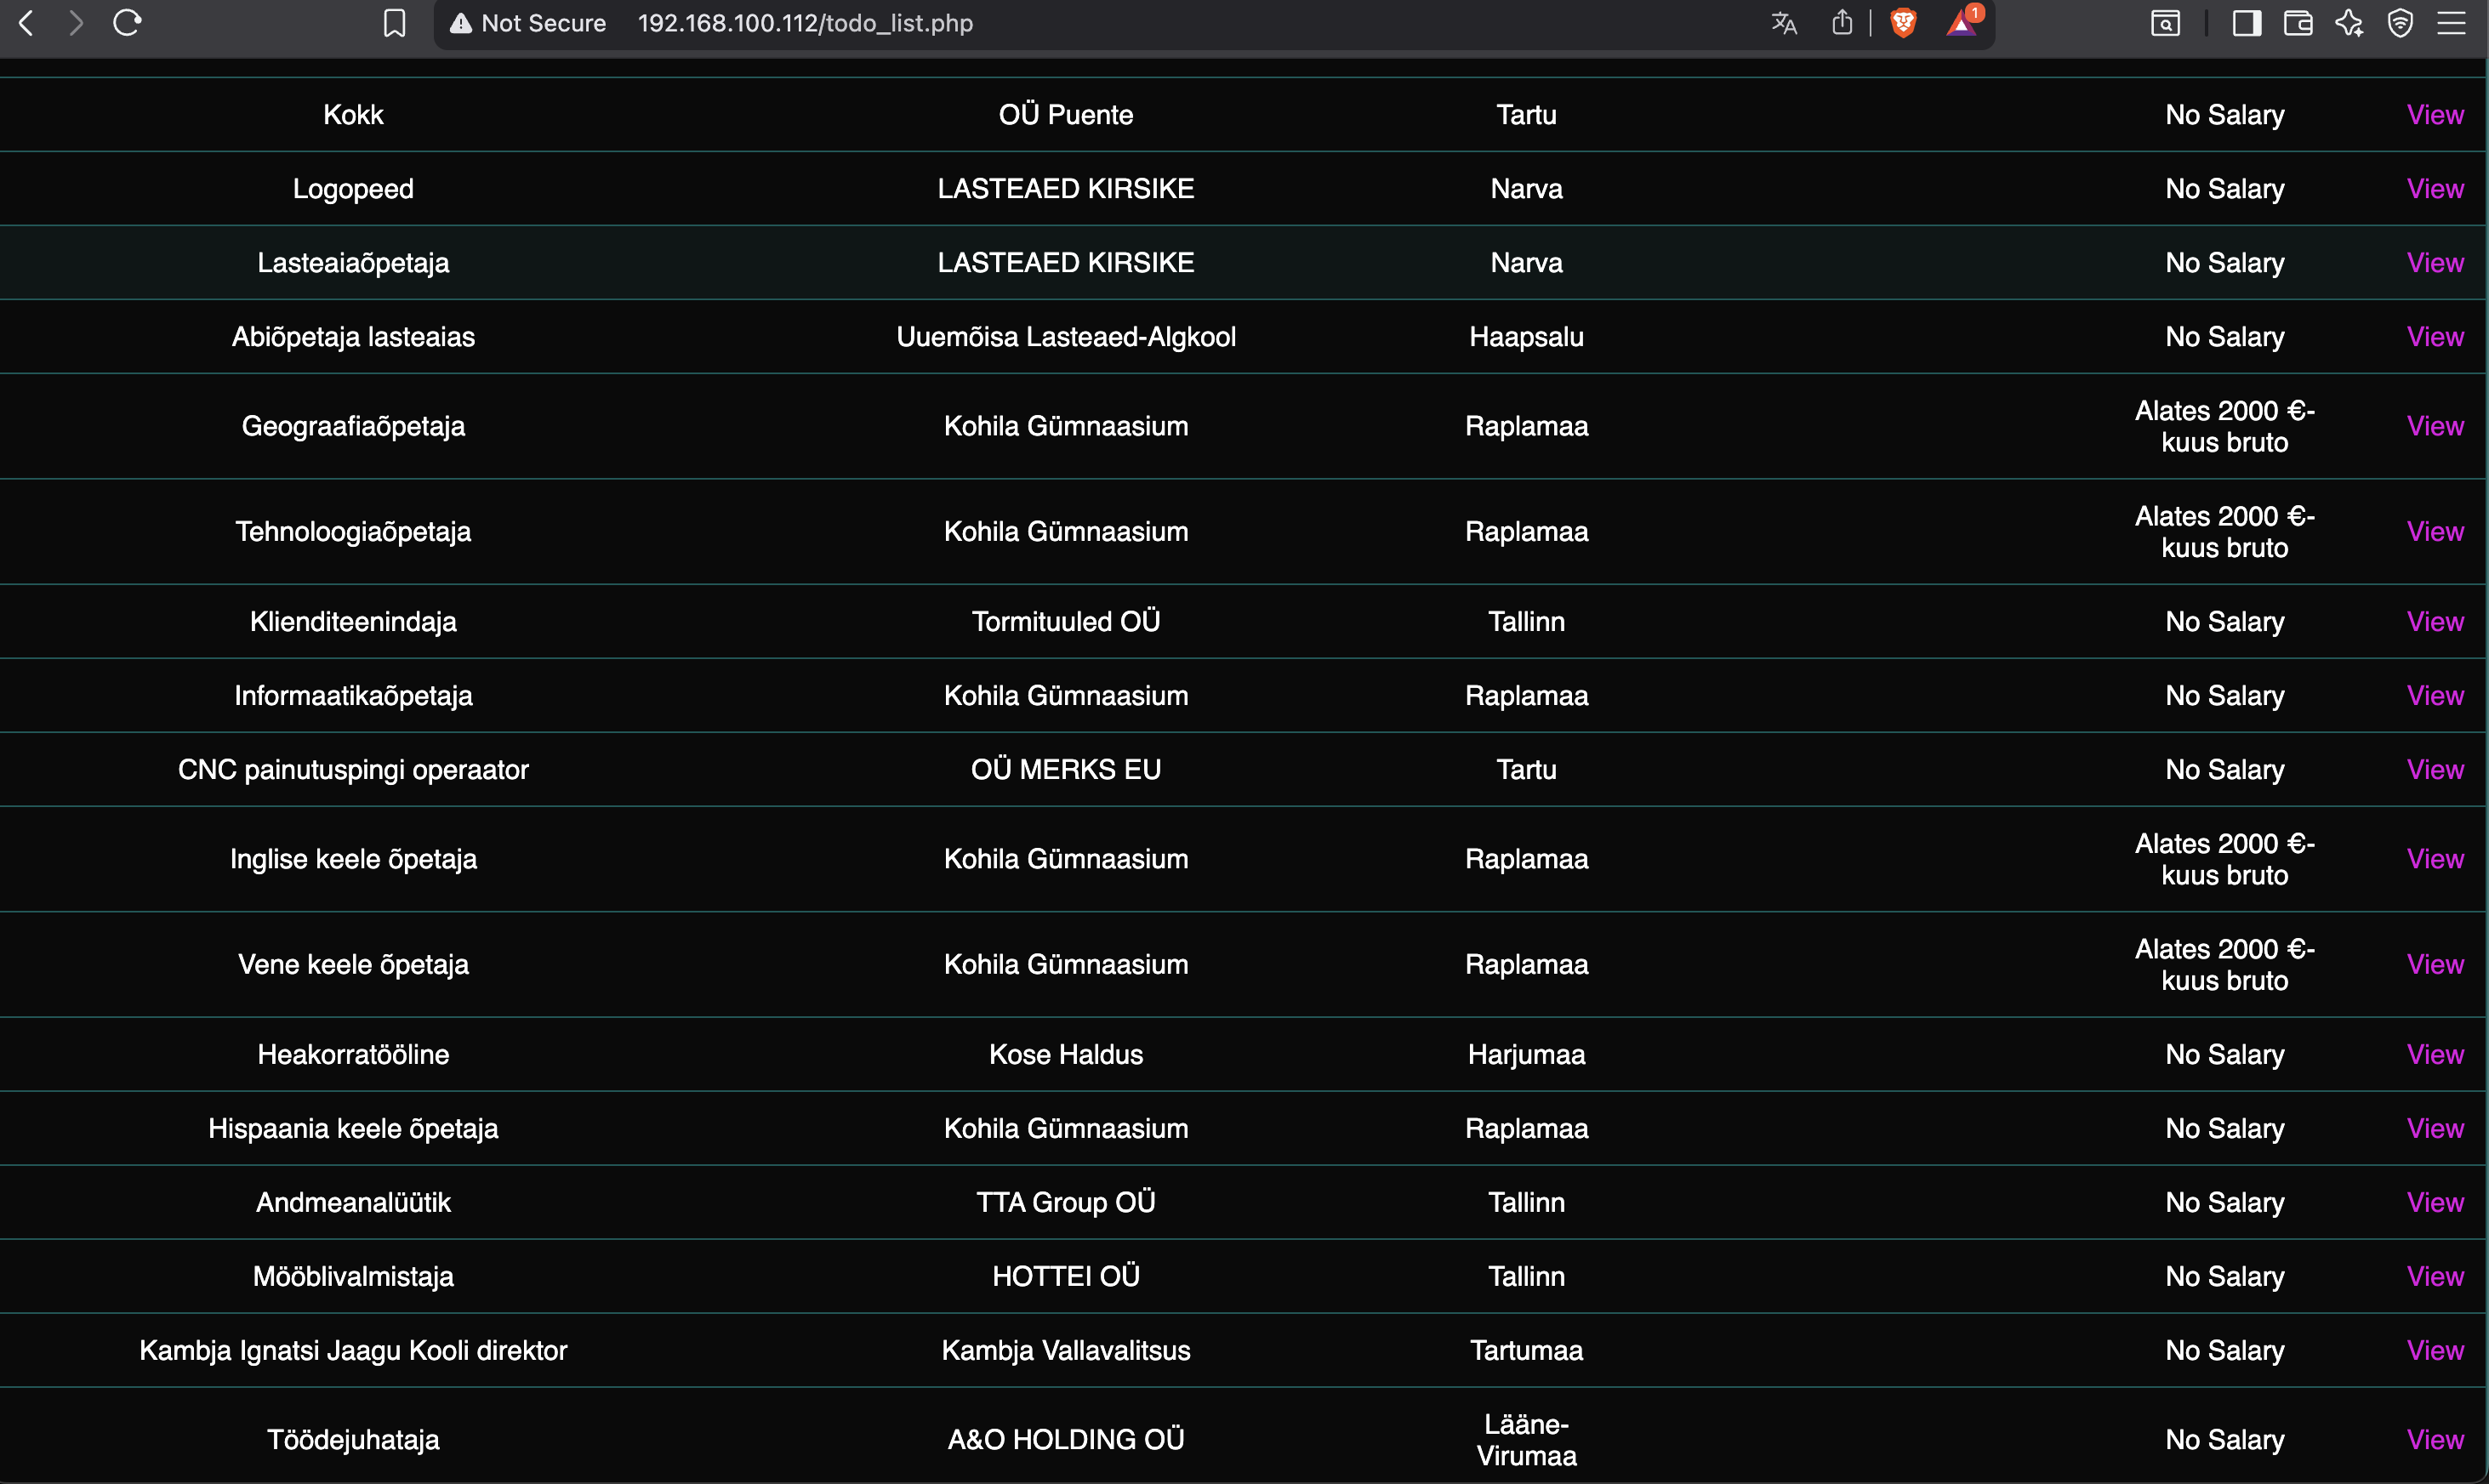
Insight: Most available jobs did not include salary information.
Key Insights
- End-to-End Pipeline: From scraping and cleaning to storing and visualizing.
- Actionable Views: Location-based maps made it easier to spot patterns across cities.
Tech Stack / Technologies Used
- Python: Web scraping, automation, data processing.
- MySQL: Database design and structured storage.
- Data Visualization: Mapping coordinates and interactive UI elements generated with Python.