Hardware Tracking & Automation
The goal of this project was to build a fully automated system for tracking hardware and software across a network of computers. It started with a simple need: understanding which devices were in use, what software was installed, and how to keep everything up to date—without manual checks.
Data Collection with PowerShell
I began by writing PowerShell scripts to gather hardware data, including PC model numbers and monitor serials. This information was exported into clean, structured .csv files. I then expanded the system to collect software data—capturing installed applications and their version numbers, also stored in separate .csv logs.
Automation & Logging
To maintain historical records, I implemented timestamped logs that track changes over time. This allowed me to monitor updates, installations, and hardware changes across the entire computer park. I also created a master log for real-time status and a secondary log for historical snapshots.
Advanced Device Detection
One major upgrade was the ability to detect all connected peripherals—such as cameras, headphones, USB drives, and even smartphones. This eliminated the need for physical inspections and gave me a complete overview of each machine’s hardware environment within minutes.
Scalability & Usability
The system was designed to be intuitive and scalable. I focused on making the logs readable and well-organized so that even a new team member could quickly understand the setup. This ensured continuity and ease of onboarding.
Impact
Over the course of 8 months, I transformed a manual, time-consuming process into a fully automated infrastructure. The project gave me deep insight into scripting, data management, and system design—and laid the foundation for future automation initiatives.
Medallion Architecture
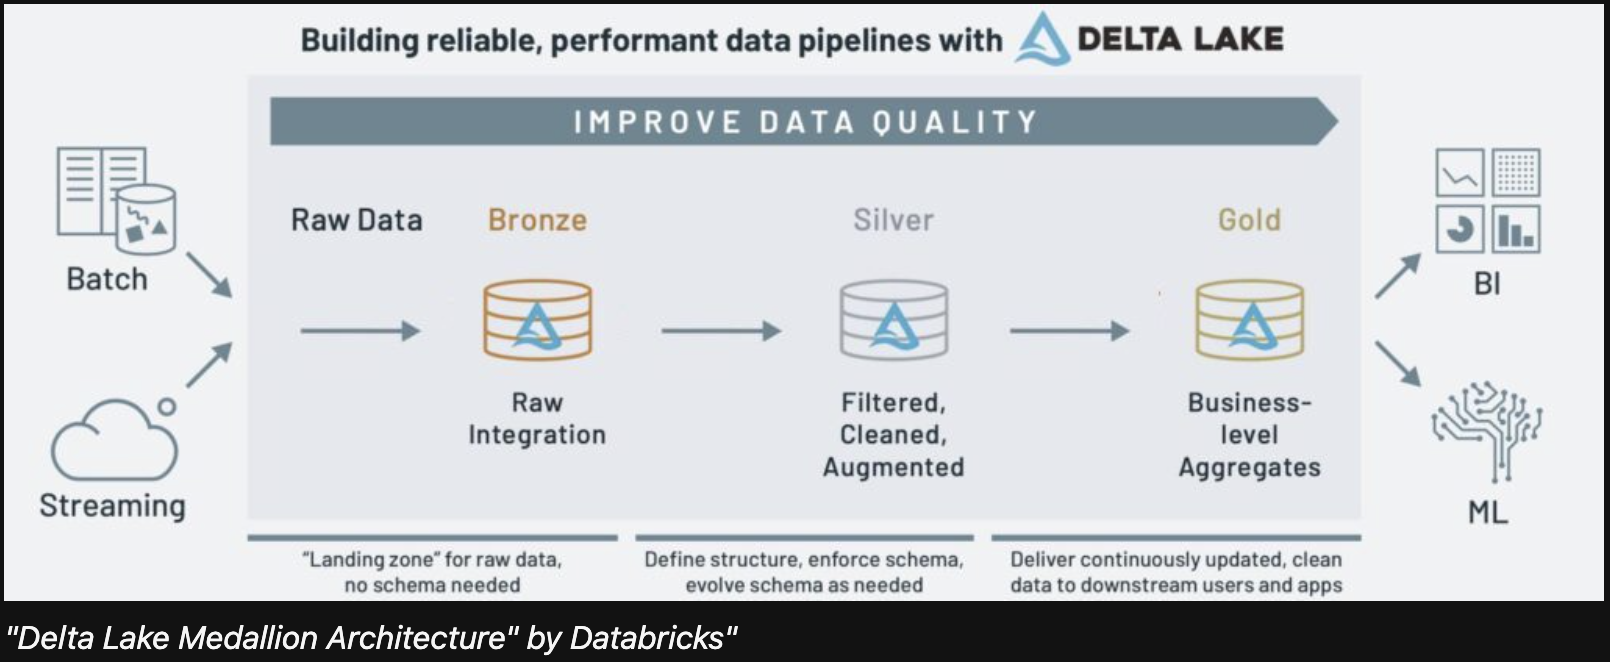
Medallion Architecture - A very good way to sort data from bronze to gold.
Data Gathering Scheme from Bronze to Gold Layer
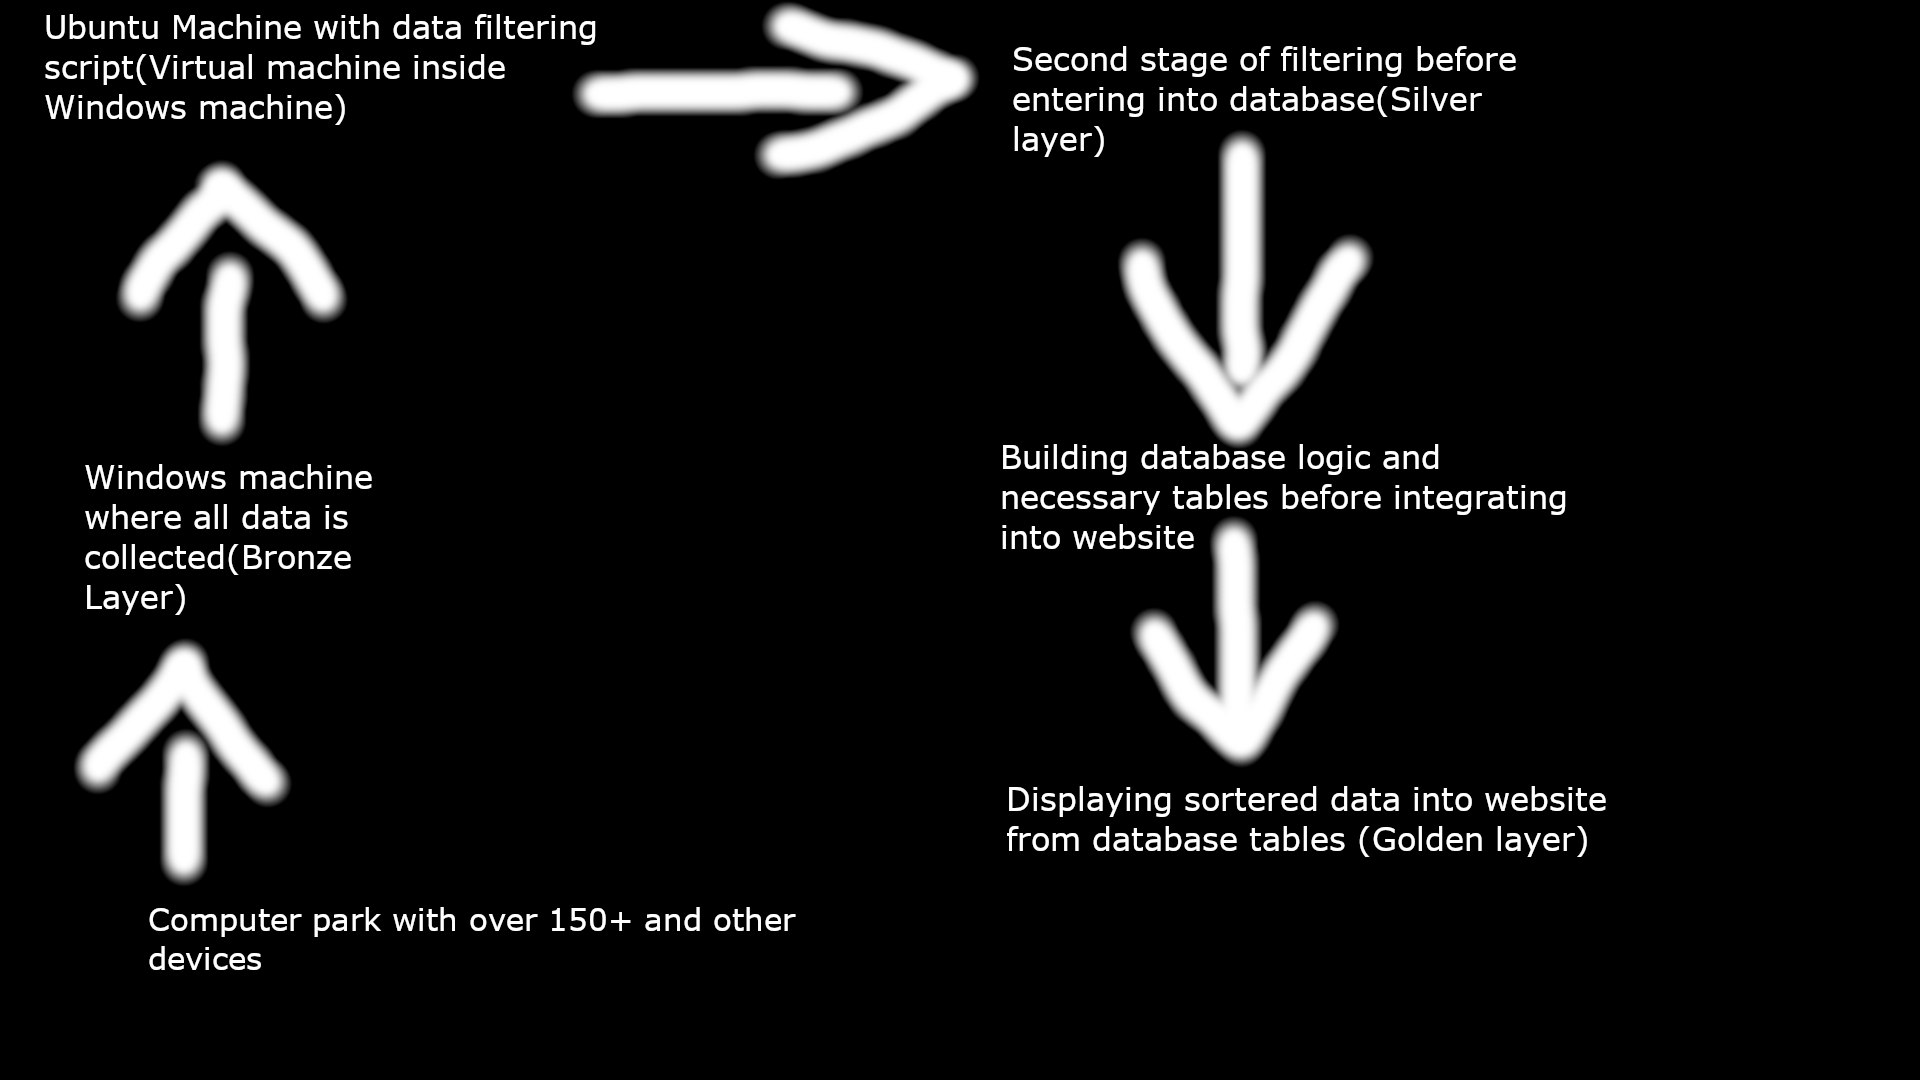
Scheme Picture 1.0
Bronze Layer — Raw Data Collection
My Windows workstation served as the bronze layer, where raw, unfiltered data was collected using PowerShell scripts. This included PC and monitor models with serial numbers—critical identifiers for tracking. I also extracted detailed device information from Device Manager, resulting in approximately 230 lines of data per computer. Across the network, this amounted to around 1.8MB of data or roughly 32,000 lines, covering all connected peripherals. I sorted and structured this data to isolate the most relevant insights.
Silver Layer — Structured Filtering
Once the foundational data was organized, I transitioned to the silver layer by moving the dataset to an Ubuntu environment. Here, I applied more specific filters to prepare the data for integration into a MySQL database. This stage focused on transforming raw logs into structured tables, making the data easier to reuse across web applications and integrate via PHP—while following the KISS (Keep It Simple, Stupid) principle.
Gold Layer — Refined, Trusted Insights
In the gold layer, I produced clean, validated datasets ready for direct use in reporting and automation. I created simplified tables showing each PC’s hardware configuration, connected devices, and software version history. I also implemented logic to flag outdated software or unusual device connections, enabling proactive maintenance. These insights were designed to be easily consumed by non-technical users or integrated into dashboards.
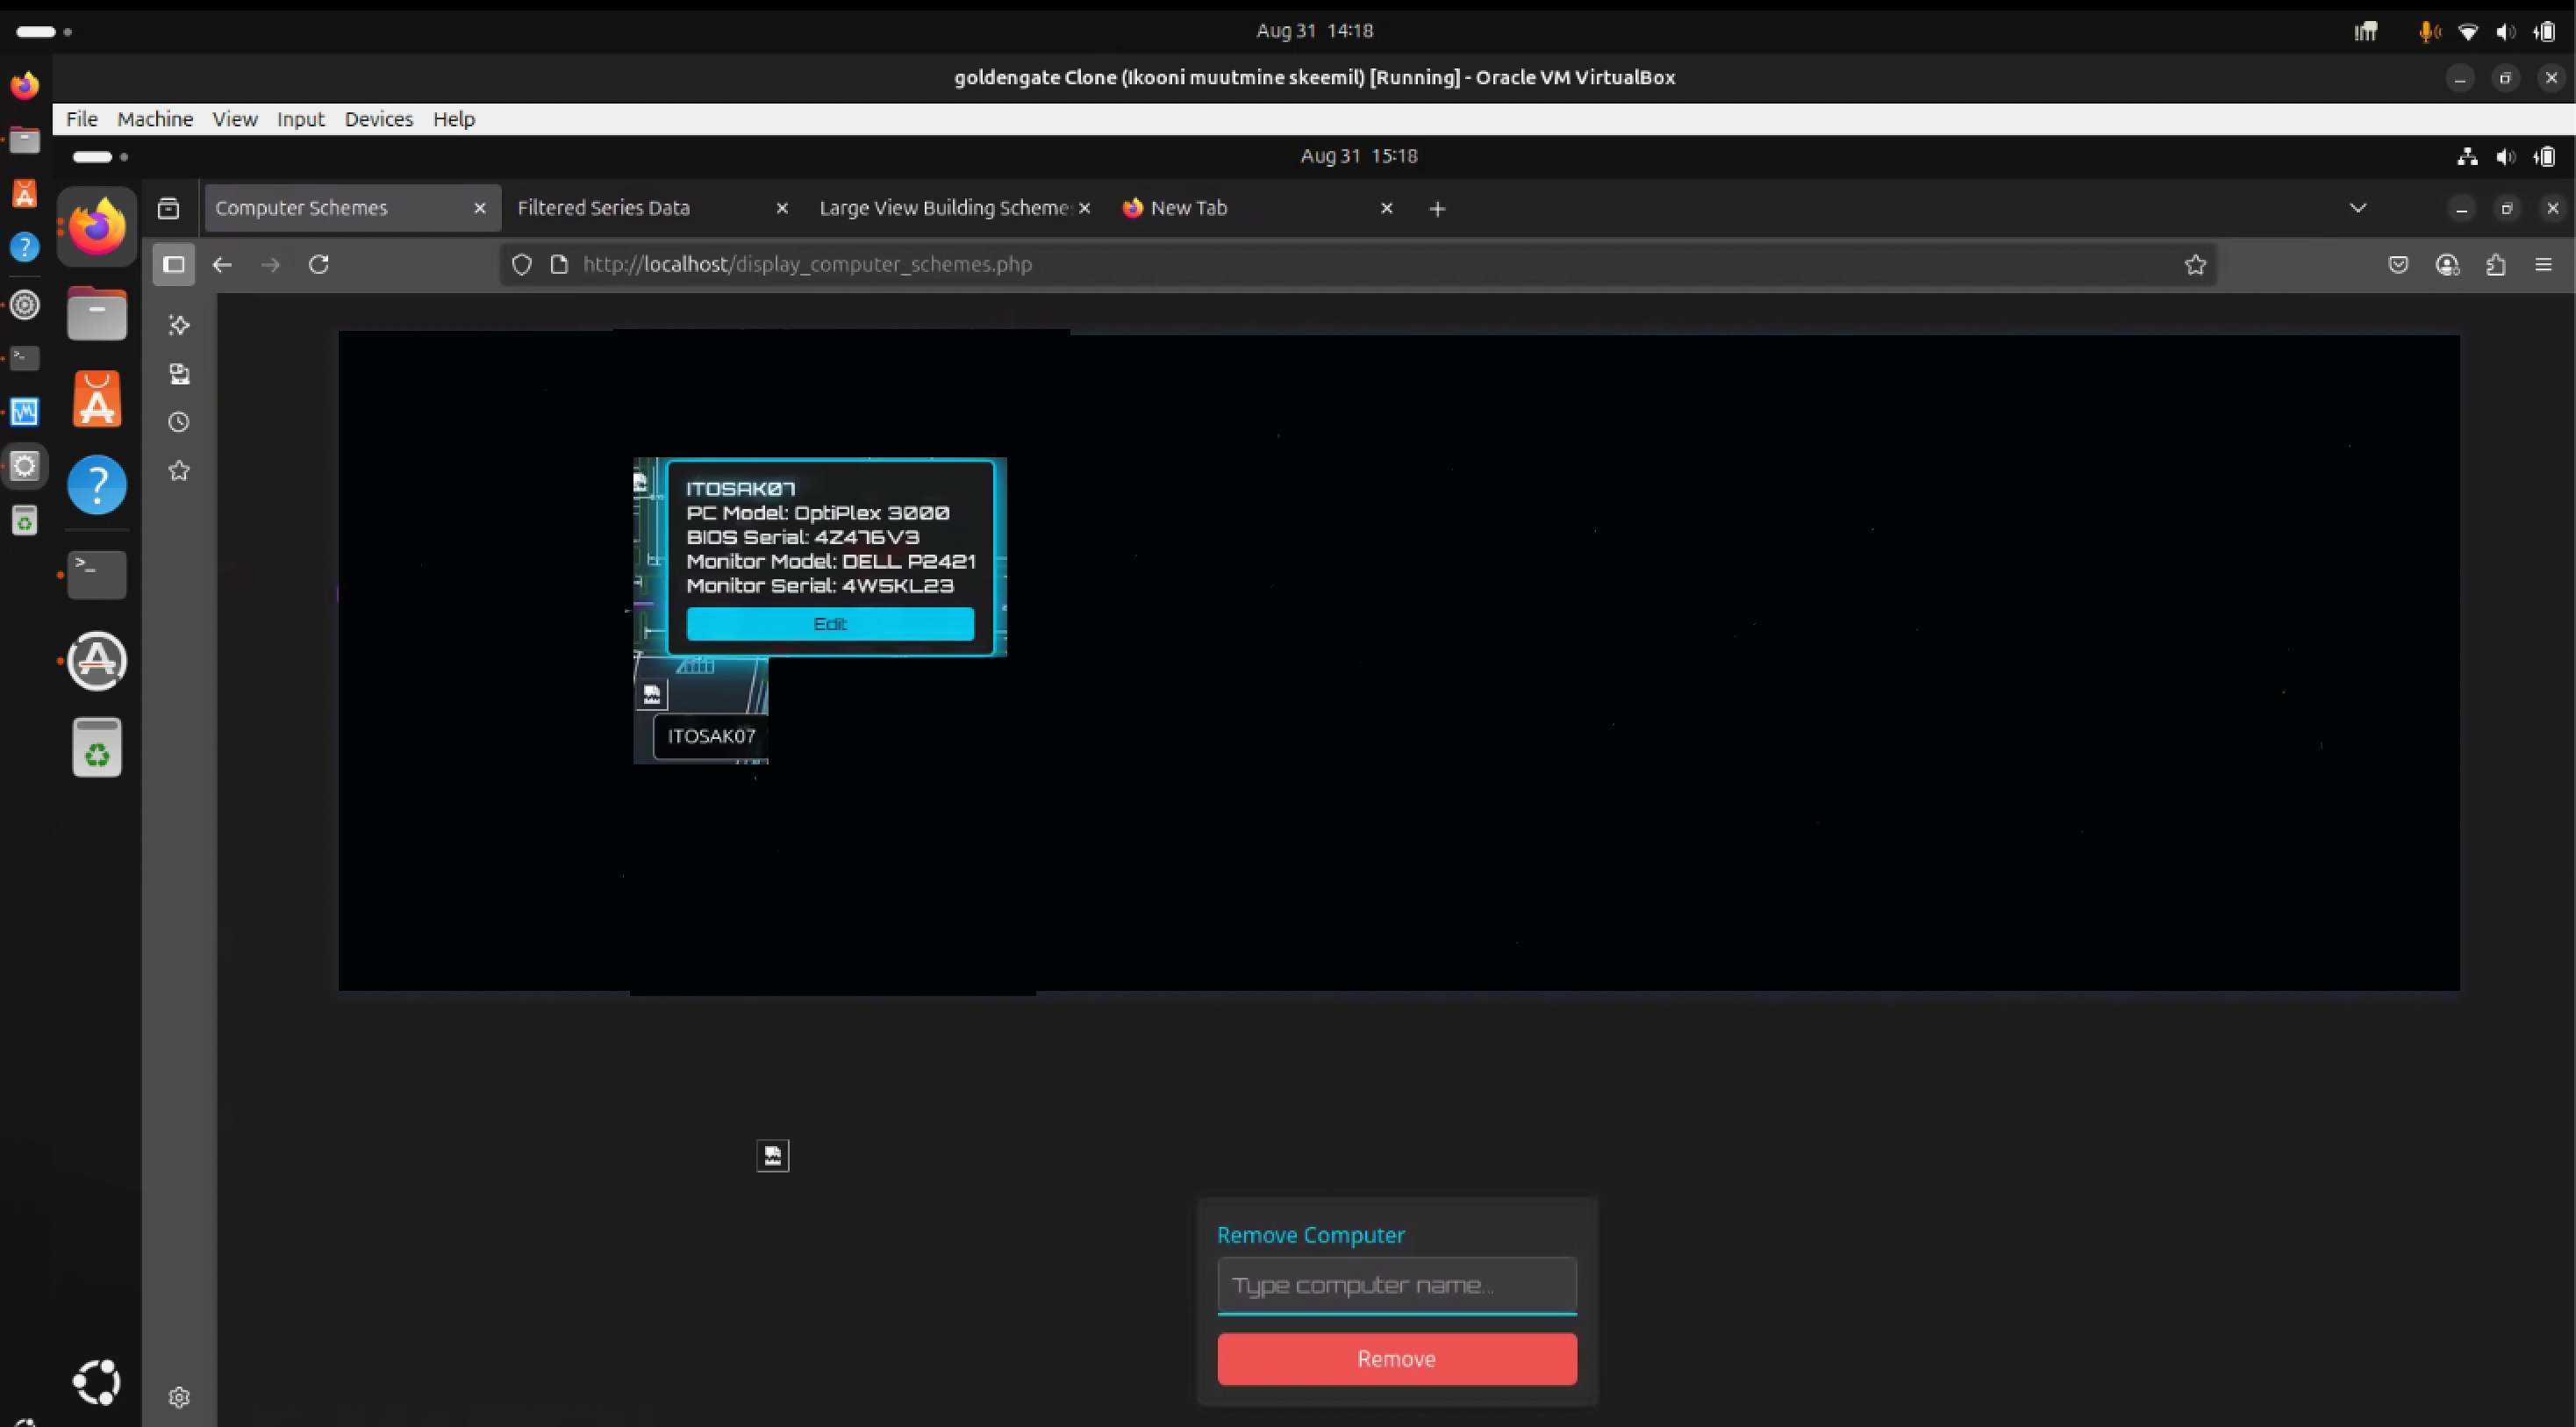
Interactive Visualization
To display this data visually, I developed an interactive scheme (Scheme Picture 1.0) that combined MySQL, PHP, and JavaScript. One of the most challenging aspects was implementing mouse-over functionality while keeping icons fixed. Debugging this interaction took several days due to logical conflicts between JavaScript and PHP. Ultimately, I created a dynamic and responsive interface that enhanced usability and clarity.
Design Philosophy
Throughout the project, I followed the KISS principle—originally coined by the US Navy as “Keep It Simple, Stupid.” In the programming world, I prefer to interpret it as “Keep It Simple, Structure,” which emphasizes clarity, maintainability, and scalability in system design.
Filtered Dataset View
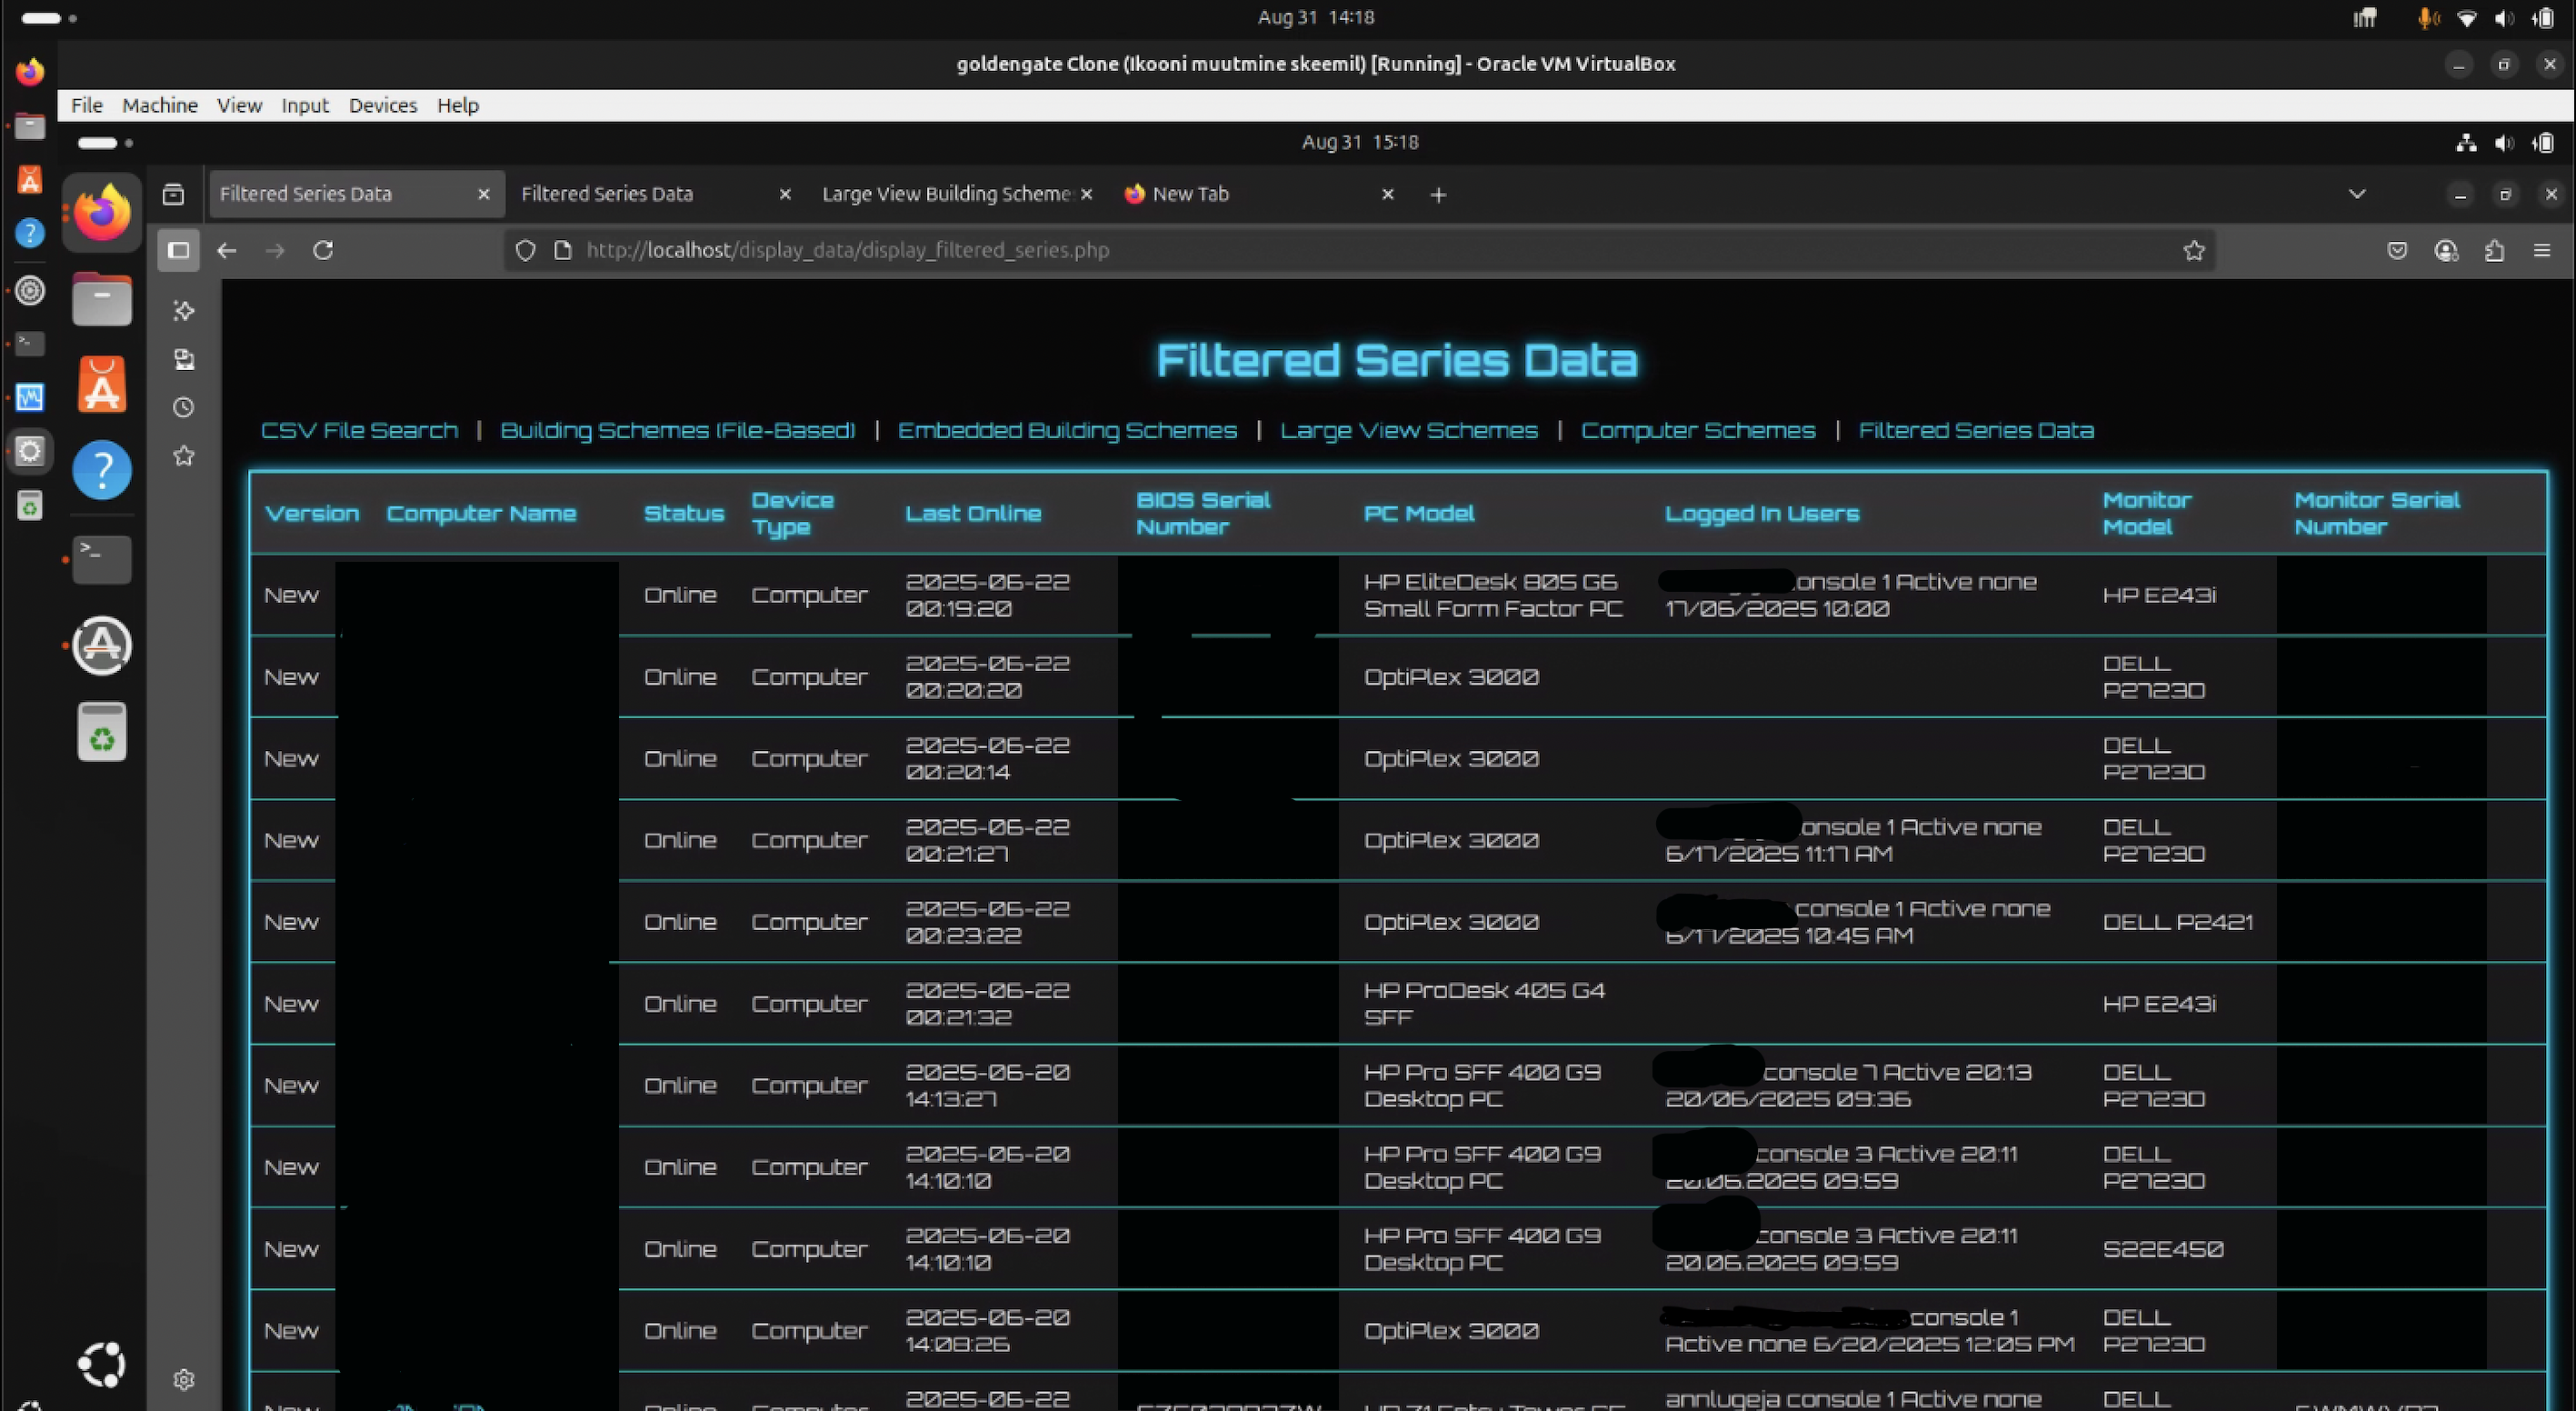
This view displays a filtered dataset showing correlations between monitor and PC models. It allows quick identification of all computers within the organization and helps determine who is using each device. Some parts of the image were blurred or painted over to protect sensitive information.
Searchable CSV Logs
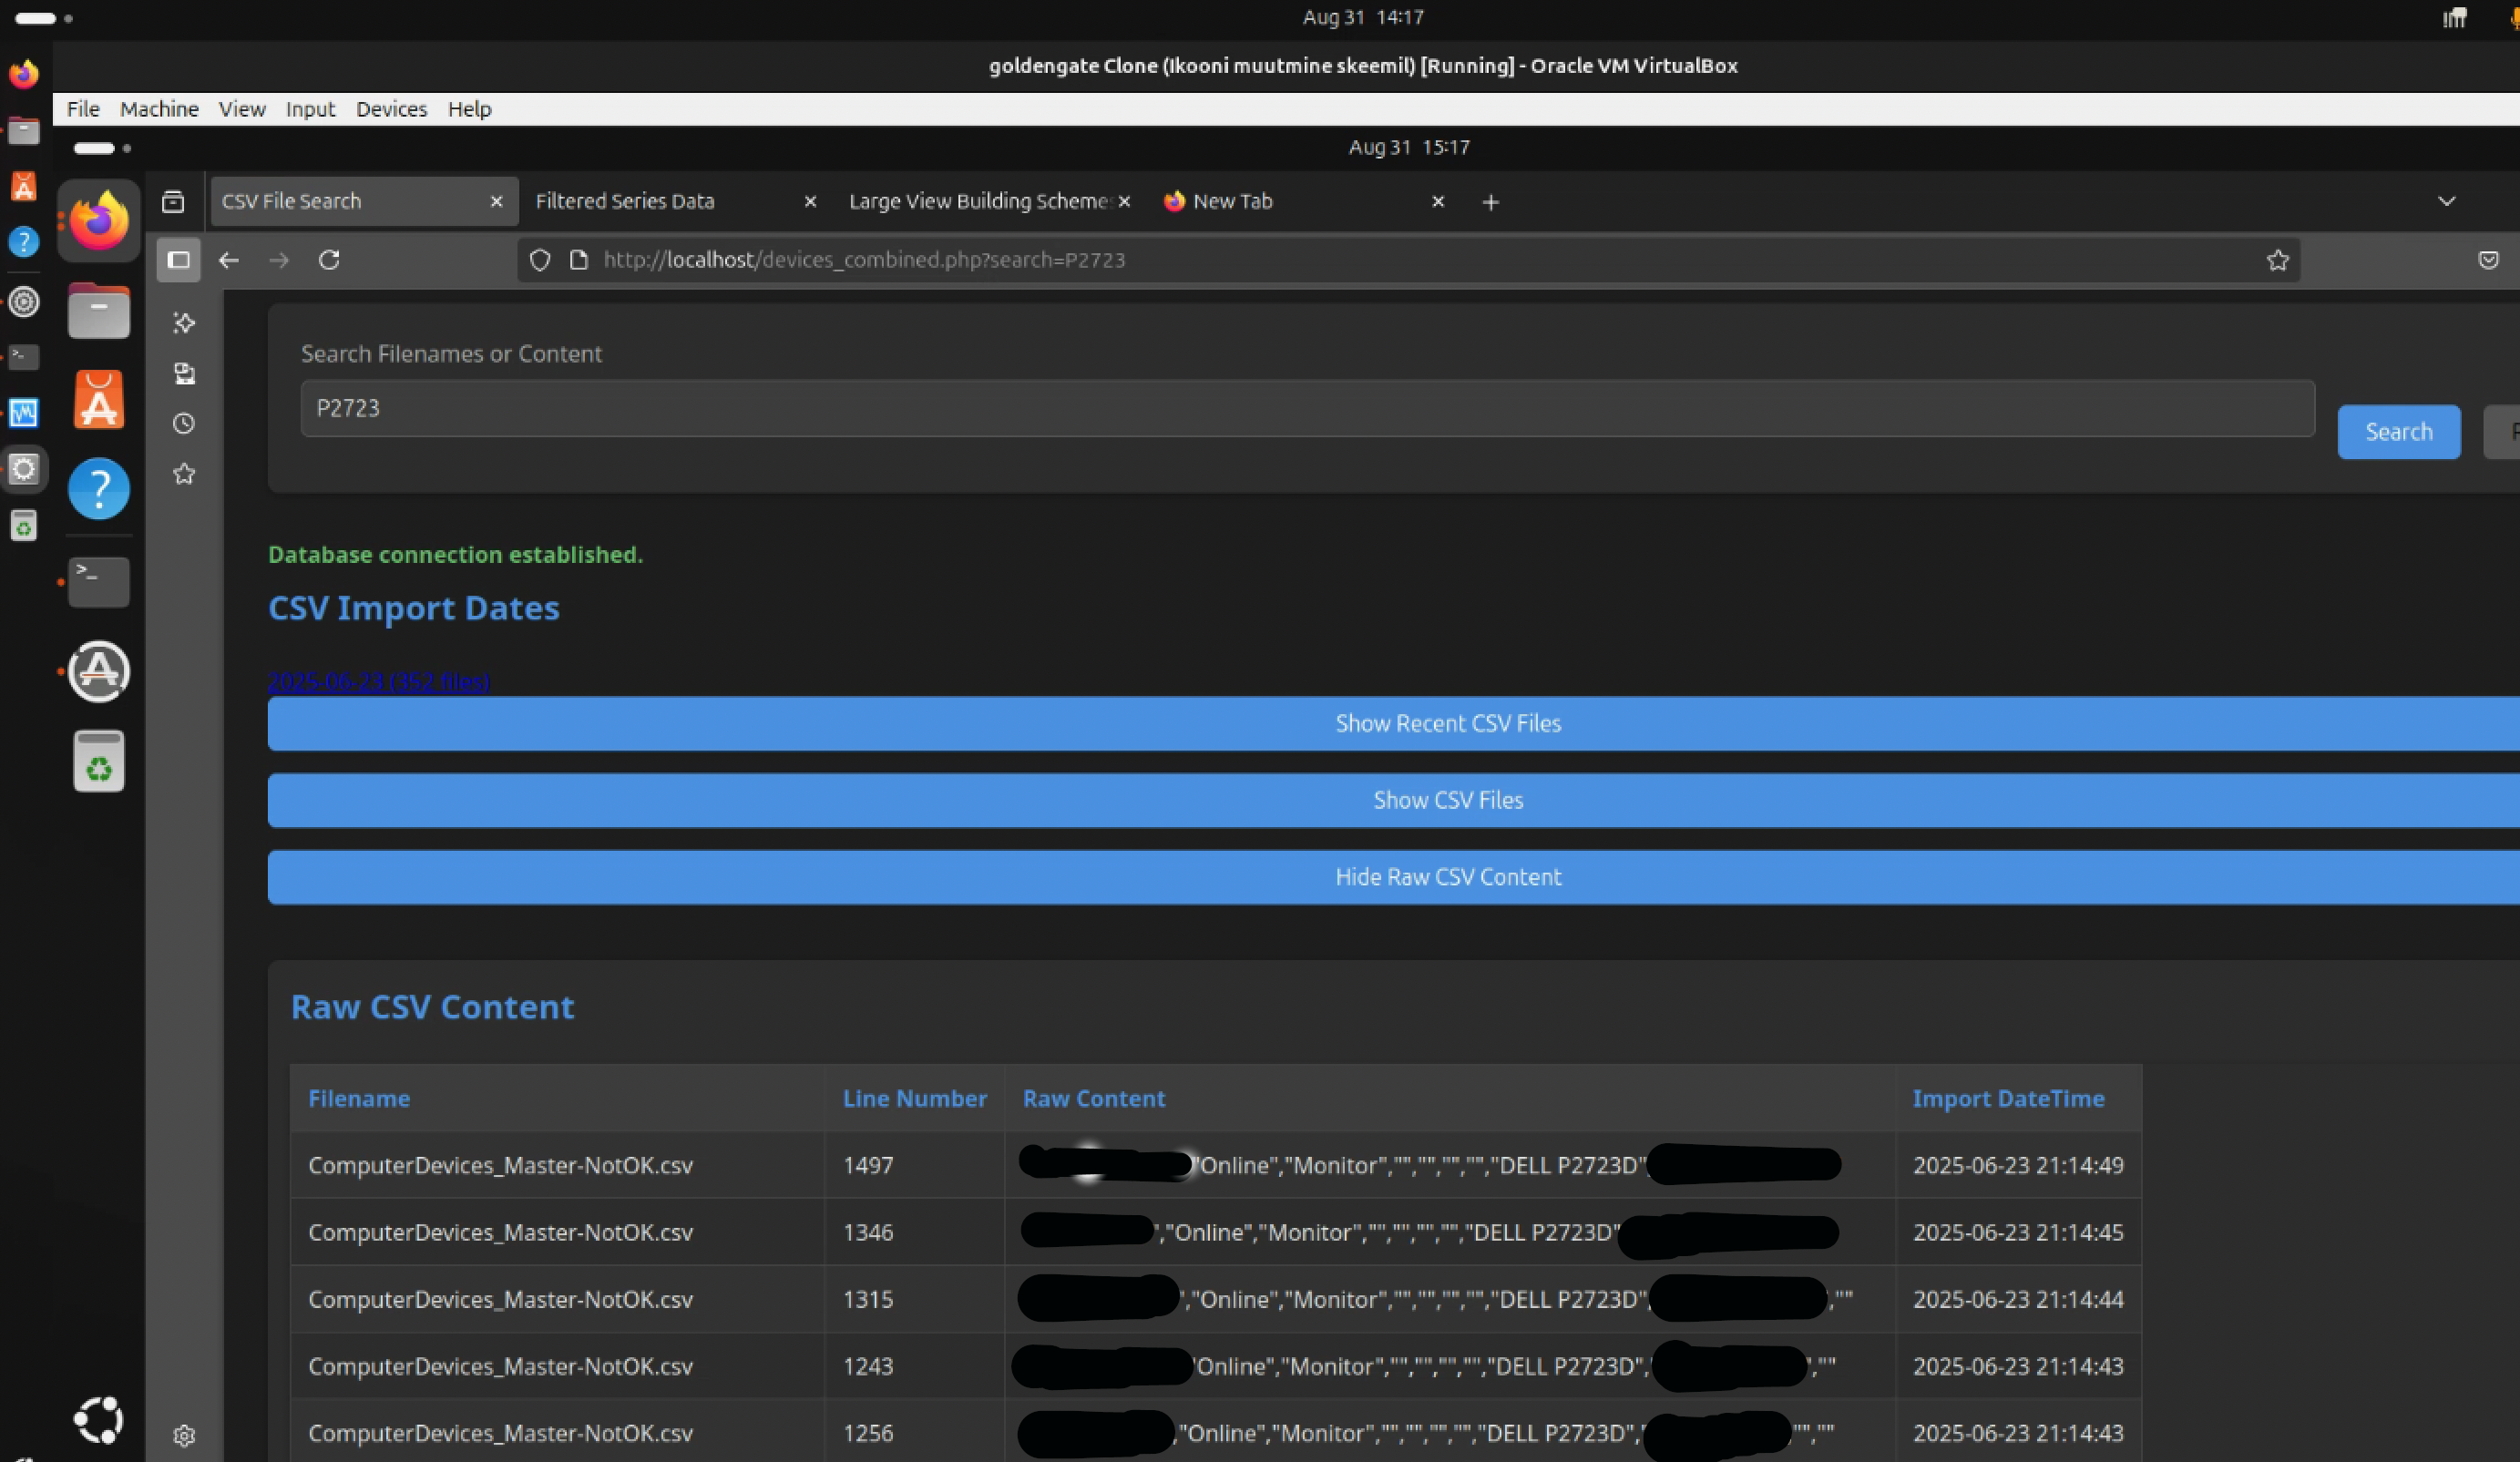
Searchable CSV logs for historical PC configurations.
Tech Stack / Technologies Used
- PowerShell: For data collection, automation, logging, device detection, and Windows-specific tasks like gathering hardware/software info and managing updates.
- Ubuntu: For the silver layer data filtering and processing.
- MySQL: For structured data storage and integration in the gold layer.
- PHP: For web application integration and backend logic in the interactive visualization.
- JavaScript: For frontend interactivity, such as mouse-over functionality in the scheme visualization.
- CSV Files: For raw and historical data logging.
- Medallion Architecture: Conceptual framework for data layering (Bronze, Silver, Gold).